
Abstract
Radio remains popular, delivering an audience reach of over 90 percent, but radio ratings may overestimate real advertising exposure. Little is known about audience and media factors affecting radio-advertising avoidance. Many advertisers have believed as much as one-third of the audience switch stations during radio-advertising breaks. In the current study, the authors combined Canadian portable people-meter data ratings to measure loss of audience during advertising. They discovered a new benchmark of 3 percent (across conditions) for mechanical (or actual physical) avoidance of radio advertising, such as switching stations or turning off the radio. This rate is about one-tenth of current estimates, but was higher for music versus talk stations, out-of-home versus in-home listening, and early versus late dayparts.
Management Slant
Overall, radio has a low level of mechanical advertising avoidance.
There is little variation in mechanical avoidance of radio advertising across media factors.
◦ Music stations have slightly higher rates of radio-advertising avoidance than talk stations.
◦ Out-of-home listening has a slightly higher rate of radio-advertising avoidance than in-home.
Light listeners drive radio-advertising avoidance in early dayparts.
INTRODUCTION
Radio remains an effective medium for reaching all category buyers, a key component for brand growth (Romaniuk and Sharp, 2016). Radio can build brand salience through audio cues, such as stating the brand name, repeating a tagline, or playing a jingle. Although radio lacks visual elements, it can conjure powerful imagery in the mind or elicit a memorable moment (Barwise and Ehrenberg, 1988), which all help to garner attention and aid in the encoding of brand elements.
Radio also provides a low-cost option for fast creative production, suitable for customized regional messages (Ebiquity, 2018; Sharp, 2017). Businesses benefit from adding radio to their media mix because of its average 90 percent weekly unduplicated reach, similar to television (Nielsen, 2017; Numeris, 2017). Another advantage of radio is building salience outside of television’s prime time, which means it can complement a television-led campaign by extending reach and frequency.
Despite the hype with streaming services in North America, radio remains a popular choice among audio listeners. As a share of total audio minutes, 51 percent of audio time in the United States and 61 percent in Canada is spent with radio. Conversely, audio streaming, such as listening to Spotify, accounts for 13 percent and 9 percent of audio-listening minutes in the United States and Canada, respectively (Edison Research, 2017; Vetrano, 2018). On a weekly basis in the United States, Pandora reaches 13 percent of the population, and Spotify reaches 10 percent (Vetrano, 2018).
Advertising dollars naturally follow media consumption. All of the advantages noted above for radio are reflected in the consistent U.S. $31 billion global advertising spend, wherein radio sits in the top five media (McDonald, 2018). Canada is among the top three countries using radio to advertise, with an annual advertising spend of U.S. $1.3 billion (WARC, 2016). In a United Kingdom study by Ebiquity, however, advertisers seemed to undervalue the potential of radio to build brand salience (Clift, 2016; Ebiquity, 2018).
This perception of radio could be based on advertisers’ belief that one-third of the listening audience avoids advertising breaks by switching stations (Generali, Kurtzman, and Rose, 2011). This belief persists because empirical benchmarks for radio-advertising avoidance behavior are lacking (Galpin and Gullen, 2000). Without a better understanding of advertising avoidance, marketers likely will continue to miscalculate audience reach, which is important for adjusting media scheduling.
The current study addresses this gap by providing the first independent academic study to investigate radio-advertising avoidance using portable people-meter data. The portable people meter is a system developed by Arbitron (now Nielsen Audio) to measure how many people are exposed or listening to individual radio stations and television stations, including cable television.
This study also adds to the limited literature on what variables influence the rate of radio-advertising avoidance. Advertising avoidance is described as “all actions by media users that differentially reduce their exposure to advertising content” (Speck and Elliott, 1997, p. 61). A comprehensive list of potential variables to test advertising-avoidance conditions was identified with a model of radio and television ratings (Webster, Phalen, and Lichty, 2000), audience-behavior theories (Barwise and Ehrenberg, 1988), theories of random consumer behavior (Goodhardt, Ehrenberg, and Chatfield, 1984), auditory-complexity theories (Potter and Choi, 2006), reactance theory (Brehm and Brehm, 1981), and affordance theory (Warren, 1984). The results of this study have implications for academic researchers and advertising practitioners.
LITERATURE REVIEW
According to one model of audience behavior, the size of the audience during programs and advertising, measured by exposure metrics such as average-minute audience, is influenced by media and audience factors (Webster et al., 2000). A media factor is the program content chosen by station owners as a strategy to attract listeners (e.g., music stations generally reach a bigger audience; Lees and Wright, 2013; Nelson-Field, Lees, Riebe, and Sharp, 2007). Another media factor, determined by the listener rather than the station owner, is listening location (in home versus out of home) and consequently the radio device used and how easy it is to avoid advertising using that device. The avoidance rate likely will be higher in a car because the radio device is only an arm’s length away (Abernethy, 1991).
Without a better understanding of advertising avoidance, marketers likely will continue to miscalculate audience reach, which is important for adjusting media scheduling.
The main audience factor is audience availability—that is, when people are available to listen. When more listeners are available, ratings are higher, but also the audience likely will include a larger proportion of light listeners (Barwise and Ehrenberg, 1988; Goodhardt et al., 1984; Webster et al., 2000). Overall, the literature related to radio advertising suggests two research questions:
RQ1: What media factors influence mechanical avoidance of radio advertising?
RQ2: Is mechanical avoidance of radio advertising affected by audience availability?
Types of Radio-Advertising Avoidance
Consumers need to be exposed to advertising for it to be effective, but full consumer attention every time is rare for any advertisement. In broadcast media, such as television and radio, advertising is interruptive (Speck and Elliott, 1997) and so differs from the self-paced advertising exposure in print media. When consumers are denied content by disrupting advertisements, it fosters psychological reactance (Brehm and Brehm, 1981; Brehm and Cole, 1966), which may trigger advertising avoidance (Friestad and Wright, 1994).
In terms of advertising-effectiveness models, benchmarks of advertising avoidance by consumers help practitioners to take the raw exposure media ratings and adjust for potential exposures that represent the opportunity to see or hear brand advertising (Galpin and Gullen, 2000). Although a benchmark for television-advertising avoidance exists (Danaher, 1995), a broad review of the literature conducted for the current study revealed that the academic research on radio-advertising avoidance has remained at a nascent stage for more than two decades (Speck and Elliott, 1997). To offset the absence of radio research, scholars utilized avoidance studies of television and opportunity to see or hear to speculate on radio-advertising avoidance behavior, suggesting that the two are parallel (McDowell and Dick, 2003; North and Van Meurs, 2004; Speck and Elliott, 1997). The current study drew on documented television findings to generate hypotheses about radio-advertising avoidance.
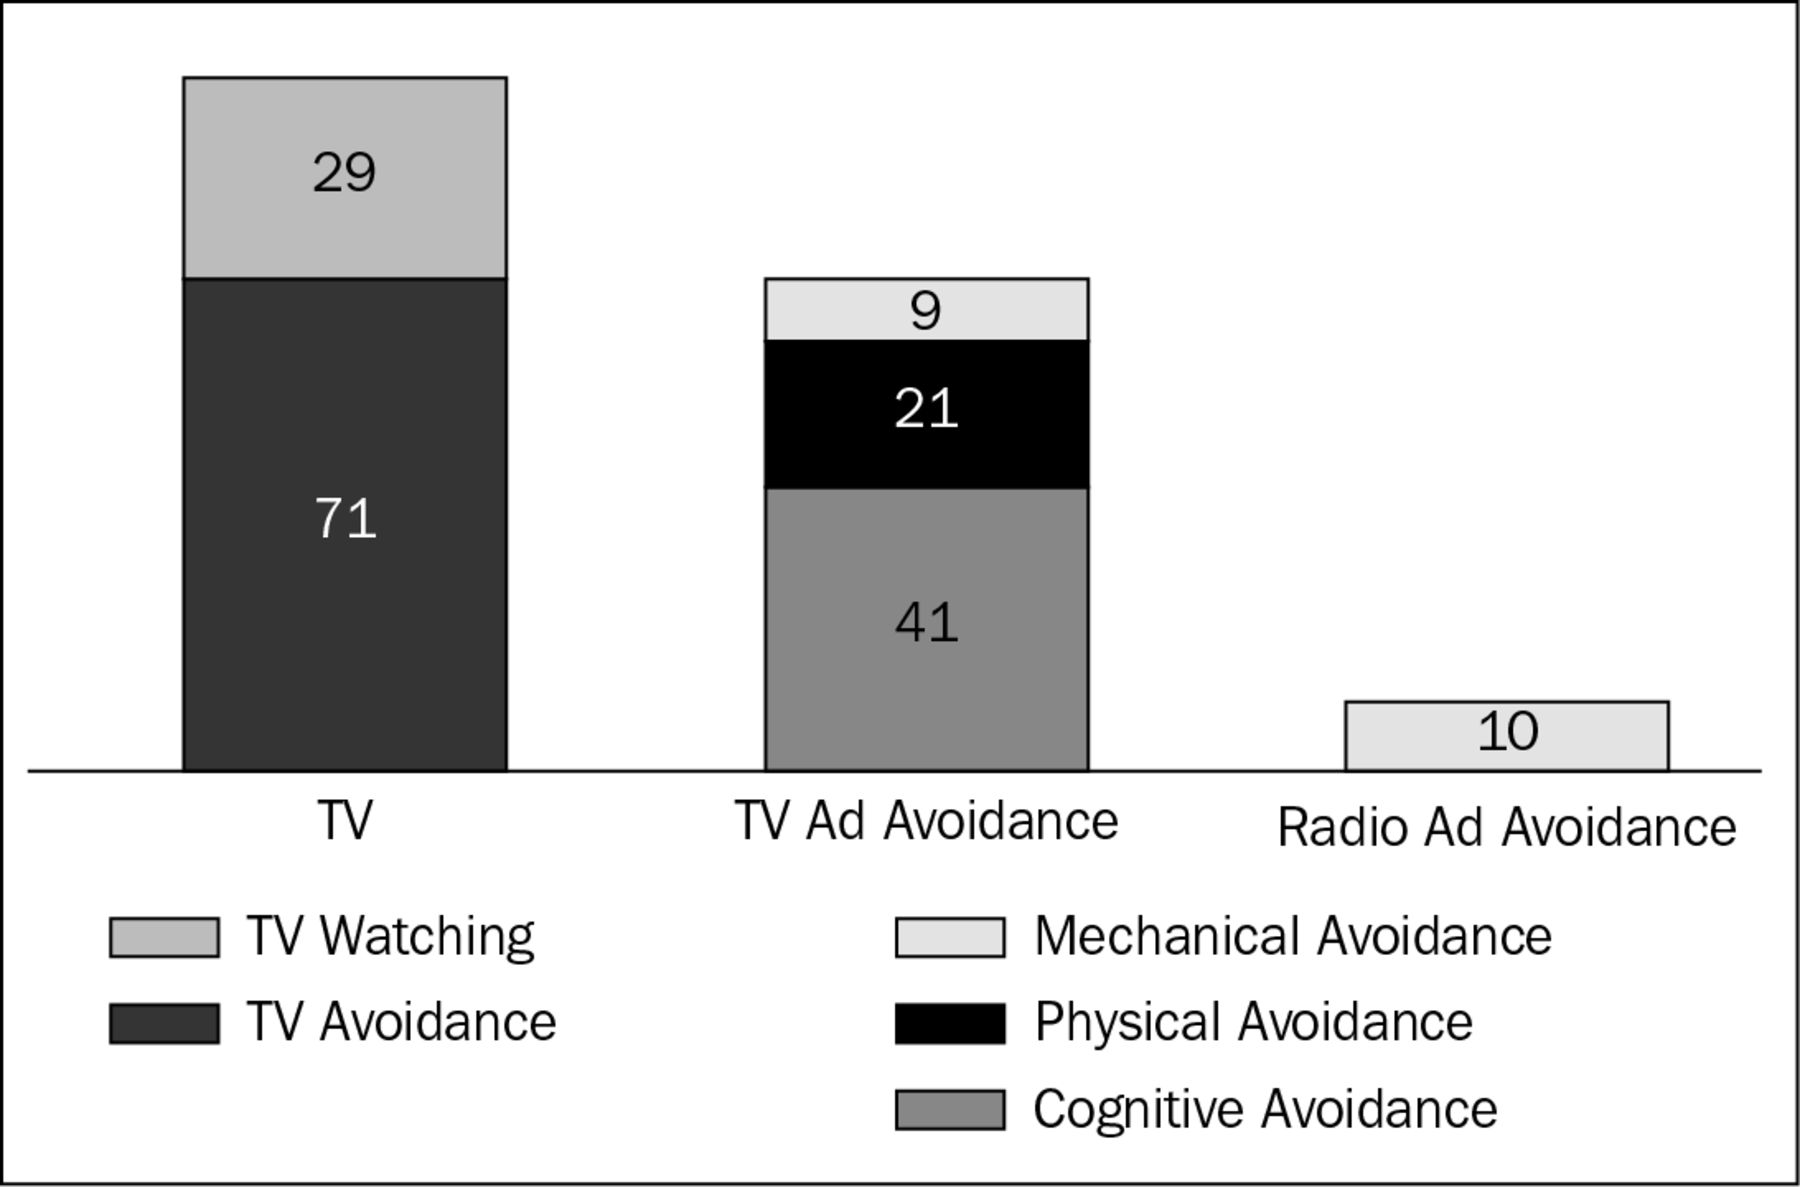
A meta-analysis of television-advertising avoidance estimated that the proportion of viewers giving full attention to a television advertisement is 29 percent (See Figure 1; Bellman, Schweda, and Varan, 2010). The residual 71 percent consists of three forms of advertising avoidance (Speck and Elliott, 1997). First, cognitive avoidance, affecting 41 percent of television advertisements, includes diverting attention by engaging in another task, such as reading, social media, or household chores. For radio, cognitive avoidance turns radio into background noise. Second, physical avoidance, affecting 21 percent of television advertisements, reduces advertising exposure when the viewer leaves the room, eliminating vision and potentially hearing. Last, mechanical avoidance, affecting 9 percent of television advertisements, is avoidance by using a device, switching television channels, muting the sound, or turning off the set.

Advertising Avoidance on Radio and Television
Sources: Bellman et al., 2010; Speck and Elliott, 1997.
Cognitive and physical avoidance of television advertising can be observed by eyes on the screen or whether the viewer leaves the room, but these signals may not indicate loss of exposure to radio advertising. For this reason, the current study focuses on mechanical avoidance of radio advertising, which can be measured reliably with a portable people meter.
Prior Studies of Radio-Advertising Avoidance
Research on radio-advertising avoidance dates back 28 years, with the majority of studies using survey questionnaires (Abernethy, 1991; McDowell, 2003; Speck and Elliott, 1997). The industry realized the shortcomings of self-reports for mechanical advertising avoidance, however, and embraced portable people meters (Pellegrini and Purdye, 2005; Webster, 2015) to record listening behavior precisely (see Generali and Kurtzman, 2015; Generali et al., 2011; North and van Meurs, 2004). Synthesizing across studies can be a suitable approach to estimate a benchmark, but given that the above studies vary in time, countries, and methods, the authors acknowledge the risk to accuracy. One solution is to apply the median to lower the effect of outliers (Bellman et al., 2010). The median across prior studies for mechanical avoidance of radio advertising was 10 percent; the range was from 50 percent less than the program audience to 8 percent more.
Reasons for the wide-ranging results between previous studies include the following:
Variation in the methods used (for examples of methods, see Abernethy, 1991; Edison Research, 2016; Generali and Kurtzman, 2015; Generali et al., 2011; McDowell and Dick, 2003; Newstead, Reynolds, and Riebe, 2009; Speck and Elliott, 1997);
Possible sampling differences specific to national conditions, such as advertising regulations (Dix and Phau, 2010); and
The time period of the studies, because advances in technology might have made switching stations easier (e.g., car steering wheel buttons).
The duration of data collection ranged from minutes to 12 months.
In addition to the incongruent findings among prior studies, some key limitations also were discovered in the literature:
No studies have been published for several years (i.e., the most recent academic study was by McDowell and Dick, 2003, and the last industry study was by North and van Meurs, 2004).
Previous academic studies may not be generalizable. These studies used small samples of university students (e.g., Abernethy, 1991; N = 101) or had atypical demographics (e.g., Speck and Elliott, 1997).
Using students may lead to the Hawthorne effect (McCambridge, Witton, and Elbourne, 2014), whereby watching behavior incites the avoidance behavior.
Survey studies very likely were affected by memory biases (Newstead et al., 2009; Speck and Elliott, 1997).
The lack of research and its disparity in results have led the industry to develop a rule of thumb for mechanical avoidance (i.e., an anecdotal benchmark). In a U.S. industry survey (Generali et al., 2011), radio-advertising avoidance behavior was believed to consist mostly of switching stations, resulting in a loss of up to 32 percent of the audience during advertising breaks, three times higher than the 10 percent median across prior studies. The current study shows that the rule of thumb can be highly inaccurate, if applied, and can lead to poor communications planning or investment. More research is needed to investigate the most effective communications investment as media continue to evolve.
RESEARCH HYPOTHESES
Media Factors Influencing Mechanical Avoidance
There are two main media factors proposed by prior researchers (Webster et al., 2000) that could affect radio-advertising avoidance:
Program content (music versus talk). Auditory-complexity theory (Potter and Choi, 2006) suggests that the audio contrast between talk advertisements and music content is identified easily by listeners’ automatic orientating response. A listener’s higher advertising recognition, as a result of increased attention due to his or her orientating response (Potter and Choi, 2006), should increase psychological reactance and mechanical avoidance (Friestad and Wright, 1994) for music stations versus talk stations (Generali et al., 2011).
Device technology determined by listening location. Affordance theory (Warren, 1984) suggests that when people are in an environment that makes it easier to perform an action, the rate of that action likely will increase. Listening to radio is most popular out of home, with 89 percent of listeners using the radio while driving, 42 percent at home, and 30 percent at work (Deloitte, 2019). A U.K. electronic-meter study noted that mechanical avoidance increased during parts of the day when people were more mobile, such as when going to lunch (North and van Meurs, 2004). In conjunction, being close to the radio device (e.g., a car radio or portable radio) allows people to interact continuously, giving them more chance to switch stations, mute sound, or turn off the device.
H1: Mechanical avoidance of radio advertising is higher for music content than it is for talk content.
H2: The highest rate of mechanical avoidance of radio advertising is associated with listeners who are outside of the home.
Audience Availability of Light Listeners
Audience availability explains why the peak in radio-audience ratings occurs about the same time each day for most stations (Barwise and Ehrenberg, 1988). Most people tend to listen to the radio in the car or on the move (Deloitte, 2019; Radio Connects, 2016). In addition, during peak times, the proportion of light listeners likely will be greatest. Light listeners were defined for this study as people who spent less time listening and listened slightly less frequently in a week compared with heavy listeners, a phenomenon derived from the Dirichlet model of near-random consumer behavior (Goodhardt et al., 1984). Each group of participants was sorted into 100-minute intervals of time spent listening.
Light listeners continually switch into the audience and out of it, increasing measured levels of mechanical avoidance for those times when the proportion of light listeners is high.
Light listeners of a station listen for less time, compared with heavy listeners, during a given time segment, such as the breakfast daypart—6 a.m. to 10 a.m. Light listeners continually switch into the audience and out of it, increasing measured levels of mechanical avoidance for those times when the proportion of light listeners is high (Webster et al., 2000).
H3: When more light listeners are available, mechanical avoidance is higher.
METHOD
Scope and Sample
The authors had access to portable people-meter data for programs and advertisements only from Canada. Vancouver, British Columbia, with its large population and ethnic diversity, was chosen because it is more representative of Canada than larger Toronto and Montreal (Statistics Canada, 2017). In 2016, Vancouver’s total population was 2.46 million, one-third with British origin and one-fifth with Chinese origin (Statistics Canada, 2017).
The dataset (N ≈ 800 panel members) consisted of portable people-meter-recorded avoidance behavior and advertising spots. Listening data were recorded on a portable people-meter device at the individual level and then aggregated to station level. These aggregated minute-by-minute data were sampled across one year, from 17 commercial stations, for weekdays (Monday to Friday) in four months, each representing one season (October 2015 [autumn], January 2016 [winter], April 2016 [spring], and July 2016 [summer]).
Data
Radio-station ratings data were recorded on Numeris portable people-meter devices, and advertising ratings came from a subsidiary of Numeris, NLogic. The advertising-ratings data comprised advertising spots, station promotions, and public-service announcements. NLogic processed and aggregated the minute-by-minute data.
To examine audience and media structural characteristics, the authors decided that station level was appropriate (Pingree, Hawkins, Bush Hitchon, Gilligan, et al., 2001). In conjunction with advertisers buying advertising spots at station level, this unit of analysis provides robust audience ratings for programming and advertising minutes (Song, Zhou, Tso, and Lo, 2019; Twyman and Wilcox, 1998).
Sample Profile
The portable people-meter panel quotas were compared with the universal estimate of 2,229,000 listeners in the Vancouver region, which was based on census statistics (See Table 1). There were no significant differences in ages, χ2(3, N = 200) = 2.45, p = 0.48, or gender, χ2(1, N = 200) = 0.01, p = 0.93. The authors used data from individuals age 12 years and older, because any mechanical avoidance on a younger child’s portable people-meter device likely would be coming from a parent or older family member.
Portable People-Meter Sample Characteristics
Time Frame
Listening across the day included four time segments, known as dayparts, as defined by the Canadian radio industry (Radio Connects, 2016):
Breakfast (6 a.m. to 10 a.m.),
Daytime (10 a.m. to 3 p.m.),
Drivetime (3 p.m. to 7 p.m.), and
Evening (7 p.m. to 12 a.m.).
The middle-of-the-night daypart was not included, because the number of people listening at that time was very low.
Audience and Advertising Break Definition
The program and advertising datasets were combined by time. Adopting the definitions used in previous television studies (Danaher, 1995; Van Meurs, 1998), the authors defined an advertising break as all nonprogram material—that is, station promotions and public-service announcements as well as commercials. Advertising-spot data are logged to the second, so the minute-by-minute audience count was repeated for each advertising unit until the next minute.
For this reason, it was impossible to reproduce the advertising-to-program average-minute audience ratio used in previous work (Van Meurs, 1998), which was based on average-minute audience during the last minute of program time. The average-minute audiences frequently were identical for the last minute of program time and the first minute of advertising-spot time. Instead, the method applied was similar to that of another study (Danaher, 1995).
Across the four months, extracted data represented, in total, 2,988,518 programming minutes and 534,071 advertising minutes, containing 841,003 individual advertising spots. On average, 42 percent of advertising breaks consisted of one advertisement unit, which showed little change in advertising ratings when compared with program minutes on either side.
Operationalizing Mechanical Avoidance
The current study measured the advertising ratio (Danaher, 1995)—the net audience reached by advertising—rather than individual differences in advertising exposure as a result of listeners switching in or out. The average-minute audience was calculated for each advertising break and for all the program content in each daypart. For this study, the advertising ratio was the daypart-average advertising-break audience divided by the daypart-average program audience, which means that the advertising audience was not counted in the program minutes.
RESULTS
Music Versus Talk
Hypothesis 1 proposed that mechanical avoidance of radio advertising would be higher for music content than for talk content, because advertising contrasts more with music content. This hypothesis was supported. The 17 radio stations in the data were divided into two groups according to their content type: music (n = 11) and talk (n = 6). A 2 × 4 (Content [Music, Talk] × Month [October, January, April, July]) repeated-measures analysis of variance (ANOVA) showed a significant between-subjects effect of content (station format) on advertising ratio, F(1, 66) = 46.571, p < 0.001, ηp2 = 0.41. There was no effect of month, and the interaction between month and content was not significant, F(3, 198) = 1.24, p = 0.30, ηp2 = 0.018. As predicted by Hypothesis 1, music content had a significantly lower advertising ratio, and therefore significantly higher mechanical avoidance, than talk content (See Table 2).
Effects of Program Content, Listening Location, and Daypart on Advertising Ratio
In Home versus Out of Home
Hypothesis 2 proposed that the highest rate of radio-advertising avoidance would be associated with out-of-home listening. A 2 × 4 (Location [In Home, Out of Home] × Month [October, January, April, July]) repeated-measures ANOVA showed a significant effect of location on advertising ratio, F(1, 67) = 16.06, p < 0.001, ηp2 = 0.19 (Huynh-Feldt corrected). There was no effect of month, and the interaction between month and location was not significant. As predicted by Hypothesis 2, the advertising ratio was lower, and therefore the advertising-avoidance rate was higher, when listeners were out of home (See Table 2).
Light Listening and Daypart
Hypothesis 3 predicted that when more light listeners were available, mechanical avoidance would be higher. This hypothesis was supported. A 4 × 4 (Daypart [Breakfast, Daytime, Drivetime, Evening] × Month [October, January, April, July]) repeated-measures ANOVA showed no significant main effects of daypart or month, but there was a significant interaction between month and daypart, F(9, 603) = 3.32, p = 0.001, ηp2 = 0.05 (Huynh-Feldt corrected). This interaction was due to a significant daypart effect for two months: October (fall), F(3, 201) = 4.10, p = 0.01, ηp2 = 0.06 (Huynh-Feldt corrected), and April (spring), F(9, 603) = 6.28, p = 0.002, ηp2 = 0.09 (Huynh-Feldt corrected). On average, mechanical avoidance tended to be higher in the earlier dayparts compared with the later ones (See Table 2).
These results might have been diluted because missing values had been recoded conservatively as 1 (i.e., no avoidance). Without recoding of the missing values, the main effect of daypart was significant across all four months (p = 0.039, ηp2 = 0.05). Avoidance was significantly higher during the daytime (10 a.m.-3 p.m.) daypart (advertising ratio = 0.96) compared with the evening (7 p.m.-12 a.m.) daypart (advertising ratio = 0.98, p = 0.01).
The higher amount of mechanical avoidance during the two earlier dayparts, breakfast and daytime, was explained by these dayparts having a higher percentage of light listeners in the audience, as predicted by Hypothesis 3. Because the ratings data were aggregated, the authors collected individual-level data using an online survey of radio listeners in the Vancouver region. Quotas resulted in a sample (55 percent women, 45 percent men, ages 12 years to older than 50 years) identical to the Canadian Census (Statistics Canada, 2017).
The survey was approved by the authors’ ethics review board, and parents gave permission for their children (ages 12–17 years) to complete the survey. Respondents entered time spent listening during each daypart. The authors summed these daypart times to calculate total listening time per day, in minutes. The sample was split into three groups that differed significantly (all differences, p < 0.001) in average (median) minutes spent listening per day: light listeners (M = 45), medium listeners (M = 150), and heavy listeners (M = 330).
The proportion of light listeners was significantly higher, compared with the evening daypart, in all three other dayparts:
Breakfast, χ2(2, N = 764) = 17.85, p < 0.001;
Daytime, χ2(2, N = 804) = 18.80, p < 0.001; and
Drivetime, χ2(2, N = 705) = 8.46, p = 0.014 (See Table 3).
Self-Reported Light, Medium, and Heavy Listeners across Dayparts in Minutes
There were no other significant differences among dayparts. Although more light listeners were in the audience for the breakfast and daytime dayparts, they spent significantly less time listening compared with medium and heavy users, in every daypart (See Table 3). This meant that light listeners continually were entering and leaving the audience, generating mechanical avoidance of advertising; when more light listeners were present, mechanical avoidance was higher.
DISCUSSION
This study is the first independent academic study of radio-advertising avoidance based on portable people-meter data. The main result of the study is a new benchmark for mechanical avoidance of radio advertising. Overall, mechanical avoidance generally was low, with an average of 3 percent across the day. Three audience and media factors slightly increased the rate of avoidance, however. Although this is a favorable result for marketing practitioners, other modes of avoidance may persevere.
Talk stations had lower mechanical avoidance than music stations, because advertising (which often includes talking) has a greater audio contrast with music content (Potter and Choi, 2006). These findings replicate content effects found in prior (mainly industry) studies in the United States, Australia, and the United Kingdom (Generali et al., 2011; Newstead et al., 2009; North and van Meurs, 2004; Potter and Choi, 2006).
Mechanical avoidance was higher out of home, most likely because of the more-accessible controls on radio devices out of home, such as in the car and on the move (Warren, 1984). Again, these findings replicate those of prior studies (Abernethy, 1991; Edison Research, 2016; North and van Meurs, 2004; O’Donohoe, 1994; Speck and Elliott, 1997). This suggests that location still matters, despite changes in technology, such as smart speakers in the home.
A new discovery was the influence of light listeners on radio-advertising avoidance (Barwise and Ehrenberg, 1988). Light listeners listen for shorter times than medium and heavy listeners, so they constantly are entering and leaving the audience. Their switching on and off, which appears to an outside observer to be at random, generates propensities of mechanical avoidance of radio listening. Each person, however, is not actually randomly switching on and off the station, so this pattern is termed generating ‘as-if-random’ propensities to avoid listening to advertising (Generali and Kurtzman, 2015). When more light listeners were in the audience, principally during the breakfast (6 a.m.-10 a.m.) and daytime (10 a.m.-3 p.m.) dayparts, the rate of advertising avoidance was higher than it was during the later dayparts, drivetime (3 p.m.-7 p.m.) and evening (7 p.m.-12 a.m.).
One reason for the high turnover of light listeners is that most radio listening is done while driving, and the turn-on and turn-off actions likely signify the beginning and ending of travel instead of advertising avoidance. The current study replicates the suggestion by a prior researcher (Danaher, 1995) that television mechanical-avoidance behavior is largely an as-if-random pattern of audience flow in both program and advertising content. Television channel-changing behavior is characterized by an almost-constant search for content that eventually settles on the least objectionable program (Klein, 1972; Zufryden, Pedrick, and Sankaralingam, 1993). The as-if-random rate of switching is systematically higher during advertising breaks, however, because sometimes advertising breaks are a juncture for ending a listening session (North and van Meurs, 2004).
Implications for Advertisers
The main finding that mechanical avoidance of radio advertising was a low 3 percent, on average, suggests that previous estimates of 22 percent to 32 percent were misleading (Generali et al., 2011). Combined with radio’s reputable persistent high reach, this study suggests that radio is also a high-quality medium, retaining much of the audience during advertising breaks.
Advertisers should be aware, however, that some variables have a large effect on this low average rate of radio-advertising avoidance. The slightly higher levels of advertising avoidance for music stations suggest that, all else being equal (i.e., equal reach of the target audience), advertising on talk stations is preferable to advertising on music stations. Large music stations, with their greater market penetration, offset this loss of exposure, however.
Another large effect on advertising avoidance is out-of-home listening. Although that may change as more homes acquire smart speakers (currently 13 percent ownership; Media Technology Monitor, 2018), for now most listening still occurs out of home, such as in the car, where advertising avoidance still more likely will occur. Again, the slight loss of exposure from in-car listening more than is made up by the higher level of reach possible when more light listeners are listening during their commutes to and from work.
Conclusions, Limitations, and Future Research
This first independent academic study of radio-advertising avoidance based on portable people-meter data has contributed a new (low) benchmark for radio mechanical advertising avoidance. These findings will help advertisers to abandon unfounded beliefs and may encourage more of them to consider using radio advertising. On the basis of these results, radio advertisers now are free to focus on those times when the greatest number of potential customers are reached, because time of day and out-of-home listening increased advertising avoidance by only 1 or 2 percentage points.
Like all studies, this one has some limitations that suggest potential future research. One limitation of this study is that the current generation of portable people-meter devices systematically overstates the rate of switching on and off, because when a listener moves out of earshot of the radio, the portable people meter thinks the radio was turned off. Built-in motion detectors, used to detect leaving the device on a desk unattended, may delete ultraheavy listeners. Current devices also cannot distinguish the person controlling the radio from passive listeners, who are credited with the switcher’s behavior. The rate of avoidance still was remarkably low, and future devices may include controls for these errors.
Another limitation is the use of minute-by-minute data, which might not have been granular enough to detect avoidance during one-unit advertising breaks, which were mostly station promotions, played between songs. Again, future research using individual-level, second-by-second data should be able to confirm whether listeners have time to avoid a five-second spot. The possibility that the low rate of avoidance found in this study was due to the low granularity of the data means that future research is needed to confirm this low rate, ideally using multiple methods of estimating the advertising ratio (Generali et al., 2011). Finally, to test whether these patterns generalize, future research should replicate this study in other countries.
Disclaimer: The processing of data and subsequent analysis and conclusions found within have been conducted outside of Numeris. Numeris has not endorsed or validated these results or conclusions.
ABOUT THE AUTHORS
Aaron Michelon is a senior marketing scientist at the Ehrenberg-Bass Institute for Marketing Science, University of South Australia. His main research focus is on advertising effectiveness and media efficiency.
Steven Bellman is the MediaScience Research Professor at the Ehrenberg-Bass Institute, University of South Australia. His research on media and advertising has appeared in the Journal of Marketing, Journal of the Academy of Marketing Science, and Management Science, and he is on the editorial boards of the Journal of Advertising, Journal of Advertising Research, and Journal of Interactive Marketing.
Margaret Faulkner is a senior marketing scientist at the Ehrenberg-Bass Institute for Marketing Science, University of South Australia. Faulkner’s research interests include understanding brand management and marketing effectiveness, primarily for non-profit organisations. Her work has been accepted for publication in the Nonprofit & Voluntary Sector Quarterly, Journal of Forecasting & Social Change, Marketing Letters, Journal of Product & Brand Management, among others.
Justin Cohen is a senior marketing scientist at the Ehrenberg-Bass Institute, University of South Australia. His expertise is in brand growth, route-to-market decision making, emerging markets (in particular, China), retailing, online advertising, and beverage marketing.
Johan Bruwer is professor of marketing in the School of Marketing, and senior research associate at the Ehrenberg-Bass Institute for Marketing Science, University of South Australia. He specializes in the marketing and consumer-behavior research fields, with a focus on the wine industry, and has published more than 150 research journal articles, book chapters, book reviews, editorials, and research reports.
- Received May 14, 2019.
- Received (in revised form) July 5, 2019.
- Accepted August 20, 2019.
- Copyright © 2020 ARF. All rights reserved.
REFERENCES
ARF MEMBERS
If you are a member of the Advertising Research Foundation, you can access the content by logging in here
Log In
Pay Per Article - You may access this article (from the computer you are currently using) for 30 days for US$20.00
Regain Access - You can regain access to a recent Pay per Article purchase if your access period has not yet expired.
Log in using your username and password
Vol 60 Issue 4


