
ABSTRACT
This study demonstrates the potential of certain neurological measures—in particular, biometrics—to identify television advertisements that successfully lead to sales. The researchers, who represent academia and industry, used direct measures of what they believe matters most to marketers: in-market sales response (from single-source data). To the authors' knowledge, the dataset is the largest ever studied: more than 100 consumer-packaged-goods advertisements for 20 Mars, Inc., brands, combined with laboratory testing from more than 1,000 respondents. The goal of the research, funded by Mars, was to identify evidence-based measures to inspire improved advertising practice and to explore the factors behind advertising effectiveness.
MANAGEMENT SLANT
Biometrics have the potential to help advertisers understand how sales-successful advertisements work, yet there is no silver-bullet measure to gauge effectiveness.
The ultimate goal of brand advertisements is to sell; therefore, testing tools must be validated against sales or other relevant behavioral measures.
Advertisers should establish in advance the desired audience response from any advertisement (e.g., laughter or attention to the brand) and use evidence-supported measures and analysis to ensure the desired response is achieved.
Key biometrics and objective coding seem useful under defined conditions, whereas traditional survey measures offer no additional value.
INTRODUCTION
Neurological measures have the potential to advance advertising theory and knowledge and revolutionize how advertising effectiveness is measured. In particular, biometrics—a range of technologies that monitor psychophysiological response—offer marketers the potential to measure aspects of, and people's response to, advertising.
In practice, neuroscientific tools should be able to identify which content to produce and air (under specified conditions) and provide feedback that results in more effective copy, more often (and less poor copy). For these tools to be useful, however, they need to
offer repeatable answers (e.g., across time and people),
be falsifiable,
be transparent (so researchers know what the tools are measuring), and
predict the future in ways that matter to marketers (e.g., sales).
The use of biometric tools to monitor people's bodies and brains has provided important insight about the workings of the brain. Consequently, vendors' discussions about and sales pitches for the tools seem to be informed by science: Brain scans and images, for example, are common in pitch presentations.
There is a difference, however, between the “practice” of firms selling services using these technologies and the advancement of science. Improving these technologies requires systematic documentation of what these tools are measuring. Robust discussion about how best to improve the technologies also is important so marketers end up with accurate tools.
There have been isolated attempts to explore the value of neuromeasures in relation to advertising (e.g., Deitz, Royne, Peasley, and Coleman, 2016; Falk, Berkman, and Lieberman, 2012; Matukin, Ohme, and Boshoff, 2016; Rossiter and Silberstein, 2001; Shen and Morris, 2016; Siefert et al., 2009; Silberstein and Nield, 2008).1 Additionally, there has been a concerted focus on better understanding neuromeasures, including the Advertising Research Foundation's (ARF) neurostandards projects, Neuro 1 and Neuro 2 (Stipp and Woodard, 2011; Venkatraman et al., 2015).
The growth in applications of neuroscience methods to marketing practice, however, still stands in contrast to the relatively low visibility of neuroscience in leading marketing journals (Plassmann, Venkatraman, Huettel, and Yoon, 2015).
The collective library thus has left many open questions. The current authors believe that further study is needed to advance existing knowledge, given the
range of neuromeasures in use,
complexity of the brain and nervous system, and
diversity of advertising stimuli that need to be studied in many and varied situations.
Researchers also must consider when to, and when not to, apply neuroscientific tools (Plassmann et al., 2015). In particular, there is still a need for large-scale studies showing that neuromeasures are “predictive of in-market outcomes” (Kennedy and Northover, 2016, p. 190).
A key objective of the current research, therefore, was to investigate further what these new tools are measuring across documented conditions. The authors aimed to be technology agnostic, providing insight into the value of using a range of key biometrics and traditional measures to identify “sales-successful” television advertisements. The authors determined “sales success” from in-market measurement of purchase behavior among those exposed to the relevant advertising—the dependent variable being in-market sales success based on single-source data.
The authors focused on the validity and value of tools that likely are scalable in many markets by a broad range of businesses. Biometrics measures (skin conductivity, heart rate, eye tracking, and facial coding) were inexpensive and noninvasive to collect with large samples of respondents, compared with the small functional magnetic resonance imaging (fMRI) sample used for Neuro 2 (n = 29). These small-sample fMRI studies very likely were underpowered (Button et al., 2013); therefore, their samples were not large enough to detect the results the researchers claimed to find, which raises doubts about the validity of these small-sample findings.
Accordingly, the current researchers set out to
identify factors that cause some advertisements to be more successful than others, and
validate a set of neuroscientific measures and metrics—what the authors describe as a “toolbox”—to diagnose advertising copy for those factors that likely will relate to later in-market sales success (or failure, or both). This objective follows previous recommendations that advertisers “need to use the right tool for the right job” (Varan et al., 2015, p. 188).
The researchers also insisted on using direct measures of what they believe matters most to marketers: in-market sales response from single-source data. By following this method—and collaborating with Mars, Inc., which provided funding, much of the copy, and media investment (more than 100 consumer-packaged-goods advertisements for 20 Mars brands)—the authors could get a real-life assessment of measuring advertising effectiveness on a grand scale.
THEORETICAL DEVELOPMENT
The authors believe the current study improves on previous research on a number of fronts. In particular, the study included
a dependent variable that reflects advertising sales impact. The dependent variable was a direct measure of in-market sales success, which reflects that these studies need to be predictive of the market to be useful (Berns and Moore, 2012; Deitz et al., 2016). The current researchers used single-source measures rather than statistical modeling of the effect of advertising on sales, as had been used in two key studies:
the ARF's Neuro 2 project, and
a 2016 Nielsen study that linked electroencephalography (EEG) measures of emotional response to lift in sales volume for 100 consumer-packaged-goods advertisements.2
Single-source data use a field-experimental approach in which households known to be exposed to the television advertisement (in-market natural exposure) are compared with households unexposed to the television advertisement. This approach enables causal rather than correlational associations to be made between advertising exposure and brand buying.
a greater number of advertisements tested. The authors tested 118 television advertisements for 20 unique brands from four consumer-packaged-goods categories (two staples, two impulse), compared with
a 2012 study (Kennedy et al., 2010; Northover, 2012) that used ten advertisements and three pairs of brands, which removed branding effects, following the ARF Copy Research Validity Project design (Haley and Baldinger, 1991), and
the ARF's Neuro 2 study (Venkatraman et al., 2015), with its 37 advertisements for 15 brands.
This approach allowed for reserving a subset of the advertisements as a holdout sample in order to make predictions to new data, rather than merely reporting overfitting to one dataset that likely would not replicate in new data (Armstrong, 2012). Although this is a small test of prediction (given the similarity of the advertisements and conditions—the advertisements came from a single advertiser and promote brands that are similar), it is a useful first step.
bigger sample sizes. The laboratory component comprised a large sample of category users, representative of the U.S. population, recruited from a southwestern U.S. audience panel (n = 1,040). This large sample ensured the study had sufficient power to detect its reported effects. A weakness of many fMRI studies is that they have used small sample sizes (n = 30 or fewer) and so very likely were underpowered (Button et al., 2013).
Similar to a 2014 study of the effects of positive emotion on advertising effectiveness (Teixeira, Picard, and el Kaliouby, 2014), the current authors used facial expression to measure smiling response and second-by-second coding of branding in the advertisement. Unlike the 2014 study, they used in-market sales for the dependent variable. By contrast, the 2014 study relied on self-reported purchase intent and other neuromeasures collected by means of webcams, such as heart rate and skin conductance. The current authors believe the reliability of these webcam measures has not yet been demonstrated convincingly. Skin conductance (or electrodermal) response measures arousal in the body's sympathetic nervous system, which increases sweating from special sweat glands on the hands and feet linked to this system (Wilke, Martin, Terstegen, and Biel, 2007). This increase in sweating allows the skin in these areas temporarily to become a better conductor of electricity (Potter and Bolls, 2012).
In short, given its robust in-market dependent variable, large number of advertisements, and large samples measured in lab, the current study offered, to the authors' knowledge, the world's highest quality dataset at the time for validating neuromeasures for advertising research. In addition, this study goes beyond identifying success, investigating the neuromeasures that can help advertising decision making under specific conditions.
A common mantra among vendors is that neuromeasures analyze the unconscious emotional responses to which traditional self-report measures are blind. In many ways, however, this idea has led to a search for “Holy Grail” measures—such as engagement. In truth, it is unlikely that any single measure will predict advertising success, as advertising impact often is the by-product of a wide range of strategic objectives, along with a multitude of very diverse creative tactics (using celebrities, music, product demonstrations, and more; Hartnett, Kennedy, Sharp, and Greenacre, 2016).
The current authors believe that marketers may find greater utility not in a quest for a single measure but in building a toolbox of different neuromeasures, traditional measures, and expert coding aligned to different strategic objectives.
The current authors advocate that there is no single “silver bullet” neuromeasure of success for all advertisements across all product categories, supported by the fact that three different studies identified three different “silver bullets”:
fMRI in the ARF Neuro 2 study,
EEG in the Nielsen study,2 and
facial expression in the 2014 Affectiva study (Teixeira et al., 2014).
Moreover, even if a silver bullet neuromeasure existed, it very likely would be a “motherhood” variable that applied across advertisements, such as desire (fMRI) or alertness (EEG), without giving detailed creative guidance about how to improve advertising in practice.
Instead, the current authors proposed that the desired response, which is the way advertisers want people to feel when watching or listening to the advertisement, should dictate the measures used.
Advertisers, the authors believe, first need to understand the response they are seeking for their advertisements and then need to use evidence-supported measures for this response (Matukin et al., 2016). In this way, these measures can serve to
predict in-market success (or remove failures), and
help creative professionals improve the content of their advertisements to achieve their objectives better (e.g., make people laugh, so they notice and buy the brand).
In the current study's sample of advertisements, more than half (57 percent) contained humor. For this reason, the researchers devised a toolbox tailored specifically for humorous advertisements. Because the objective of a humorous advertisement is to make the audience laugh, it followed that the key neuromeasures in this toolbox should be those that measure facial expression investigated in relation to the different types of humor techniques used.
Facial expression measures revealed
the proportion of the audience who smiled at all and who smiled above a particular threshold indicating genuine smiling, and
the moments during which a substantial proportion of the audience genuinely smiled.
LITERATURE REVIEW
It long has been known that there are different advertising challenges, with competing models proposed to classify different conditions and corresponding tactics recommended for success. The current sample of advertisements mostly can be classified as “low-involvement transformational,” on the basis of the Rossiter–Percy classification, since the advertised products were low-risk purchases and consumers purchase them for positive-ending motives, such as sensory gratification (Rossiter and Bellman, 2005). The Rossiter–Percy grid has four quadrants reflecting different advertising conditions (high/low involvement informational versus high/low involvement transformational) and recommends that advertisements attempt to elicit different emotional trajectories for each of these quadrants (Rossiter, Percy, and Donovan, 1991).
Prior research has tested the effectiveness of advertisements eliciting these recommended emotional trajectories, compared with advertisements with other emotional trajectories, by comparing consumers' responses to 33 advertisements across the quadrants and from various categories (Kover and Abruzzo, 1993). Advertisements eliciting the recommended emotional trajectories had higher levels of self-reported purchase intention.
For the low-involvement/transformational quadrant, the recommended emotional trajectory starts with neutral emotion and ends with strongly positive emotion (Rossiter and Bellman, 2005). More than 20 years later, a study using computerized facial expression coding confirmed that a peak in positive emotion (smiling) later in the advertisement, after the brand has appeared, increases self-reported purchase intent, compared with advertisements that peak earlier, before the brand has appeared (Teixeira et al., 2014).
Accordingly, the current authors expected that a first indicator of success would be that the advertisements in their sample demonstrate a rising slope of positive emotion (measured by smiling facial expression), especially if the objective of the advertisement was to make people laugh. Given the weaknesses of self-reported purchase intent measures and their poor correlations with actual future buying, however, testing this indicator of success with measures other than purchase intent was crucial to advance advertising knowledge.
A likely second indicator of success, the authors expected, would be the height of the peak at the end of the recommended rising slope in positive emotion.
Advertisements without a humor objective could rise, with a steep slope, from extreme negative emotion to peak with merely neutral emotion.
Advertisements with a humor objective could have a rising slope of smiling but still not rise to a high enough peak to guarantee success.
Another strand of research into the effects of emotional experiences over time has identified a combination measure, the average of the peak and the end, as the key summary of an experience (Baumgartner, Sujan, and Padgett, 1997; Fredrickson and Kahneman, 1993). The current authors expected that there would be a greater likelihood of success for humor-objective advertisements that had a higher peak-end smiling average.
Humor is just one of many ways that advertisers can achieve rising positive emotion in an advertisement. The advertisements in the current study's sample used a variety of other techniques, such as warmth and drama, but the majority used humor. This is why the authors focused the balance of this study on the toolbox for identifying success of humorous advertisements, even though a rising slope of positive emotion (smiling) likely would be predictive of success for other low-involvement, transformational advertisements.
Advertisements can achieve humor using many techniques (Berger, 1976), such as action (e.g., slapstick), language (e.g., puns), logic (e.g., absurdity), and identity (e.g., eccentricity). To explore whether the type of humor technique used influenced the success of humorous advertisements in this dataset, a team of trained coders triple-coded each advertisement for the presence of 41 different humor techniques, using a typology specifically developed to code humor in television commercials (Buijzen and Valkenburg, 2004).
The importance of combining measures (e.g., “liking” and branding) also has been noted in traditional advertising measures research (Kennedy, Sharp, and Rungie, 2000) and likely will be equally important with these new measures. It is possible, for example, to have a very funny advertisement with weak branding, so that viewers confuse or do not register the brand and hence are not influenced to buy it. Much work likely is needed to know which combinations of biometrics (and potentially traditional) measures matter most and in what conditions.
METHODOLOGY
The Research Team
Marketing scientists from the Ehrenberg-Bass Institute of the University of South Australia; global food manufacturer Mars, Inc.; and MediaScience, a lab-based audience measurement and marketing research firm, collaborated on this study. The project was codesigned by all the parties, with scientific robustness and business relevance as key requirements:
The Ehrenberg-Bass Institute contribution was mainly in questionnaire and study design and expertise on how advertising works and how consumers behave.
Mars, Inc., provided funding, much of the copy and media investment, the single-source measurement of effectiveness, and practical expertise.
MediaScience both contributed to the study design and collected the data, in line with the agreed design.
The data analysis was conducted collaboratively by Ehrenberg-Bass and MediaScience researchers, incorporating MediaScience's biometric algorithms, and findings were reviewed and explored for their strategic implications by all parties. As such, while each of the parties contributed something unique, the project could not exist without the close collaboration among them.
“Good Investors” Philosophy in Advertising
Like any smart investor, Mars, Inc., believes one should know where to spend to get the highest return and where to stop spending when the desired effects do not occur. In the area of advertising effectiveness, the decision to invest in single-source measurement reflects what Mars refers to as the “good investors” philosophy: to know whether an advertisement worked and put more money behind “good” advertisements and, at the same time, stop airing the bad ones. In the end, the annual investments in advertising and media at Mars sum up to a significant amount of the company's resources.
Although the “whether an ad works” knowledge is crucial, it is equally important to understand why it works or does not work. That, the current authors believe, is more fundamental knowledge about how advertising works, which can be used to improve the company's briefing and production of advertising moving forward. In the absence of continuous measurement of viewers' reactions (i.e., their smile or attention second by second), one cannot diagnose why one advertisement performed better than another, considering that their hard metrics, such as the level of branding, are comparable. Such knowledge is crucial for learning how to make better advertisements and testing whether the advertisement delivers on the desired response—in this case, makes people laugh.
Arthur C. Clarke's third law, that “any sufficiently advanced technology is indistinguishable from magic” (Clarke, 1973, p. 36), may celebrate neuromarketing as technology, but positioning that law as science requires transparency. Here, the current authors believe, the excessive hype and secret “black box” methods stand in clear conflict with the standards of science. The asymmetry of information between the providers and most users perpetuates the issues.
In order both to advance the field and to bring the best value to Mars, the research team decided it was beneficial to invest in continuous measurement of viewers' reactions, to fully decompose viewers' processing of advertisements, and link this measurement with the gold-standard data—single source—to validate the findings. As such, the value of this dataset from Mars's perspective represents millions of dollars spent on the advertising copy, media, and the single-source measures.
Experimental Design and Sample
Testing occurred at MediaScience's Austin, TX, lab in October, 2015. The sample comprised 118 advertisements (from 20 brands) obtained from Mars, Inc., that had been aired in various English-speaking countries from 2012 to 2015. Most brands were well-established global brands, but they varied in size. A sample of 1,040 adults was drawn from MediaScience's existing audience panel according to criteria designed to reflect category users for the relevant categories (51 percent women, 49 percent men, ages 18 to 83 years, across a broad range of occupations).
Each lab participant chose one of three half-hour programs to watch (“Big Bang Theory,” “Modern Family,” or “The Voice”), given that people typically are exposed to advertisements in content that interests them. These programs included four midroll advertising breaks, each with seven advertisements, for a total of 28 advertisements. Of these, eight were test advertisements, shown at positions 3 and 5 in each break.
Participants were allocated randomly to one of 33 variations, which rotated the identity and position of test advertisements to vary the mix of brands seen and avoid order effects. Across the sample, each test advertisement was seen by at least 49 participants. In each variation, each brand was represented by just one advertisement, which allowed brand recall to be measured for all advertisements.
Participants each sat in individual NeuroQube® stations (at MediaScience, Austin, TX) and watched the content on a large computer screen. A NeuroQube® is a portable computer desk with multiple flat screens; a large television-like computer screen; a small smartphone screen; and a medium-sized tablet screen, also used for answering survey questions. The computer in the NeuroQube® runs content on the screens and stores time-locked data from multiple biometric and facial-tracking measures.
Biometric measures of participants' emotional arousal were recorded while they watched, as follows:
Electrodes were attached to three fingers of each consenting participant's non-dominant hand. The microcurrent flow between two of these electrodes measured skin conductance. Also referred to as “electrodermal response,” skin conductance increases when special sweat glands are activated by arousal in the sympathetic nervous system, which is responsible for fight or flight responses.
The other electrode measured pulse rate by means of changes in skin color caused by blood flow (photoplethysmography). The time between pulses, the interbeat interval (IBI), is longer when heart rate slows down, as it does when people pay attention to external stimuli (Lacey, 1967; Lang, 1994).
These two measures were time locked to each second of the content. Additional time-locked measures were gathered by a high-definition camera (recording facial expression) and eye-tracking equipment (fixation location).
After the viewing session, participants completed a traditional survey measuring ad and brand recall and ad liking. Each laboratory participant was compensated for time and travel with a $25 gift card.
Biometric Measures
Four biometric measures were used:
Skin conductance. Average skin conductance was measured in microsiemens on a second-by-second basis. Higher skin conductance means higher bodily arousal and therefore indicates a more intense emotional experience and more cognitive resources for memorizing. In addition, peaks in skin conductance were identified and counted to yield the number of skin conductance responses over the duration of the advertisement. Each peak potentially indicates an orienting response to relevant external stimuli (Potter and Bolls, 2012).
IBI. IBI is the time between heartbeats in milliseconds (1,000 milliseconds = 60 beats per minute). To control for individual differences, average IBI during each second was expressed as the percentage change from the individual's average during the resting baseline period before he or she saw any study content. Peaks in IBI (very slow heart rate) indicate orienting (attention) responses to external stimuli.
Smiling (facial expression detection). The authors measured computer-detected smiling activity, expressed as a t statistic (i.e., t >2 = significant joy [laughing]), with positive scores indicating smiling and negative scores nonsmiling. The authors adjusted this raw t statistic for individual differences by subtracting the participant's resting baseline average. Seconds when this adjusted score was above an empirically determined threshold were coded as “genuinely smiling”:
Smiling above threshold = 1, otherwise 0. MediaScience previously derived an audience-level measure: when 20 percent or more of the audience for that advertisement were smiling above threshold;
percentage smiling above threshold (20) = 1, otherwise 0. This approach best controls for high levels of noise at lower thresholds and focuses on humor with relatively wide appeal, which is critical if mass advertising is to work.
Branding exposure. Each second of the advertisement was expert coded for the presence of branding or brand-distinctive assets (e.g., brand characters) to calculate the percentage of branding compared with the total duration of the advertisement. The coders were Ehrenberg-Bass Institute research assistants with experience across a range of coding projects, trained and supervised by the authors. Fixation time, the time when eyes were not moving and absorbing information, was calculated in seconds. These two numbers were multiplied to yield number of seconds of exposure to branding.
Traditional Measures
After the viewing experience, the same participants answered an online questionnaire (as recommended by Deitz et al., 2016) that captured the following:
Unaided recall. Before any other advertising-related questions were posed, participants were asked to freely recall any brands they remembered being advertised during their viewing session. Correct brands (misspellings allowed) were coded 1, otherwise 0.
Aided recall. Participants were then given the advertised product categories as cues and asked to recall any brands from those categories that were advertised during their viewing session. Correct brands (misspellings allowed) were coded 1, otherwise 0.
Visually cued recall. Then participants were shown three unbranded images from each test advertisement. They were asked to write the name of the advertising brand in a textbox. Correct brands (misspellings allowed) were coded 1, otherwise 0.
Ad liking. Finally, participants were shown three branded images from each advertisement and told that they had, in fact, seen this advertisement, even if they could not remember it. They were asked how much they liked it on a single-item measure with 1 = “I disliked it very much” and 6 = “I liked it very much” (Bergkvist and Rossiter, 2007).
Coding Measures
The advertisements were triple-coded for the presence of various types of content, with the final code determined by majority vote across the team of coders. All codes used in the analysis were above the 0.7 cutoff, according to a 1994 study's proportional reduction in loss measure of reliability (Rust and Cooil, 1994).
Humor techniques used. If any of the 41 humor techniques was present, that technique was coded 1 = present, otherwise = 0. In addition, if any technique belonged to one of Buijzen and Valkenburg's (2004) eight categories of humor techniques, that category was coded as present.
Second-by-second coding. Each second of every advertisement was coded for the presence of branding, distinctive assets, surprise, and humor.
Dependent Variable
It is important to note that the dependent variable, in-market sales success, was not made known until after the independent variables were collected, processed, and declared. This blind process ensured there was no possibility that the data could be manipulated consciously or unconsciously to predict more accurately the dependent variable (e.g., Doyen, Klein, Pichon, and Cleeremans, 2012).
The dependent variable data came from a single-source panel in the United States. The sales indexes calculated for individual commercials are a proprietary measure, similar to the short-term advertising strength measures used in two seminal single-source studies (Jones, 1995; Wood, 2009). The measures rely on a “natural in-market experiment,” where they compare rate of buying for those exposed compared with those not exposed with relevant controls for known confounds (e.g., as discussed by Taylor et al., 2013). The indexes were determined over two separate advertising periods to ensure a sufficient number of exposures across households for a reliable measure.
Television commercials were considered
1 = “poor,”
2 = “fair,”
3 = “good,” or
4 = “excellent”
compared with the average sales index for the category in the selected time period that the data were collected. Although the use of four points is less granular than the percentage increase measures used in statistical modeling studies (e.g., Venkatraman et al., 2015), the process allowed direct comparisons across the varied product categories and countries.
For most of the analyses, this 4-point scale was converted into a binary measure of success, with 0 = “not successful” (1 or 2) and 1 = “successful” (3 or 4). This generated an almost 50/50 split of the advertisements—that is, a chance level of 50 percent—and reflected the realistic decision of classifying the advertisements into useful groupings (whether or not to air the advertisement) that often needs to be made by practitioners.
Five-Part Analysis
The humor analysis in the current article focuses on 89 television advertisements. This is a subset of advertisements for brands available in the United States (and specifically the laboratory's test market in Austin, TX) that aired in the United States, for which the dependent variable was available. (The single-source measure was available for n = 109 of the 118 advertisements). These advertisements came from four consumer-packaged-goods categories: two staple categories, and two impulse categories.
There were five parts to the analysis:
describing the independent variables,
investigating the relationships between the independent variables and sales success,
splitting the sample to compare performance,
using machine-learning methods, and
exploring the potential of the conservative “check-box” approach.
First, the authors described the independent variables to understand their levels and variability. Measures with outliers that likely would skew results were eliminated. In other datasets, these variables (e.g., skin conductance responses) may be distributed more normally and therefore may be useful. Smiling and skin conductance levels also were compared with benchmarks taken from trailers for sitcoms and drama shows, which are known to generate high levels of humor.
Next, the researchers examined the relationships between the independent variables and sales success, using each single variable as well as sets of variables. They used logistic regression to explore what level of fit was possible for traditional measures versus biometric measures. For this sample of advertisements, only biometrics (78 percent correctly) classified or “predicted” success or failure significantly better than chance (traditional measures achieved a 58 percent correct rate).
It is crucial to note that the term “prediction,” as used here from a single study, is in line with much current practice in regression analysis. The authors, however, acknowledge that for a result to be routinely predictable (e.g., into the future and into different samples of advertisements), it must recur consistently under a range of known conditions, which typically requires many sets of data (Ehrenberg and Bound, 1993). Getting to the position where scientists can make evidence-based strong predictions about how different samples will respond to different advertisements, in terms of all the responses biometrics can measure, will be a long journey requiring many other varied data. This first step, however, looks promising for further exploration of these measures.
The third analysis split the sample into an easy decision set, predicting success comparing poor (1) and excellent (4) advertisements, and a hard decision set, comparing fair (2) and good (3) advertisements. Traditional measures did better than chance in the easy task (79 percent correct versus 88 percent for biometrics) but no better than chance in the hard task (60 percent versus 76 percent for biometrics).
In the fourth analysis, the researchers explored the potential of machine learning, given the growing interest in this area. Using neural net models, which emulate the way the human brain classifies success and failure (Taylor, 2016), the researchers achieved even higher levels of fit (up to 99 percent). While such fit levels look impressive, it is expected that they represent over fitting—given they are based on a single study. Even worse, the neural net model tended to ignore biometrics and traditional variables in favor of variables that allowed for uniquely identifying each advertisement's success level (e.g., a unique identification number in the dataset), with no logical explanation. This practice highlights the potential risks of uncritical adoption of machine learning–derived measures.
Finally, the authors used a conservative checklist approach, checking whether the advertisement met certain criteria, similar to the approach used in other studies that have tried to predict advertising success (e.g., if advertising includes one or more proven persuasion principles, it more likely would be successful; Armstrong and Patnaik, 2009). Drawing from expectations for humorous advertisements derived from the literature, the current authors developed a list of likely indicators of success using biometrics, traditional measures, and expert coding. They matched these variables to humor, defining a toolbox for humor advertisements.
For some of these indicators, the threshold was not data driven. The presence of a humor technique, for example, was a yes/no coding decision that applied across datasets. Similarly, the significance of the slope of smiling was a statistical test based on the t statistic for the slope coefficient, and this rule also could be applied to any dataset.
For other indicators, however, such as the peak–end level of smiling, a cutoff needed to be estimated from the data. For these data-driven cutoffs, the data were split randomly into a calibration sample (60 advertisements, 67 percent of the total) and a holdout sample (29 advertisements, 33 percent of the total), each with an approximately equal chance level of success (calibration 46 percent, holdout 42 percent).
Variables with significant differences between successful and unsuccessful advertisements in the calibration sample were tested as candidate check-box rules in the holdout sample. The cutoff typically was the midpoint between the successful and unsuccessful average in the calibration sample.
RESULTS
Successful versus Unsuccessful Advertisements
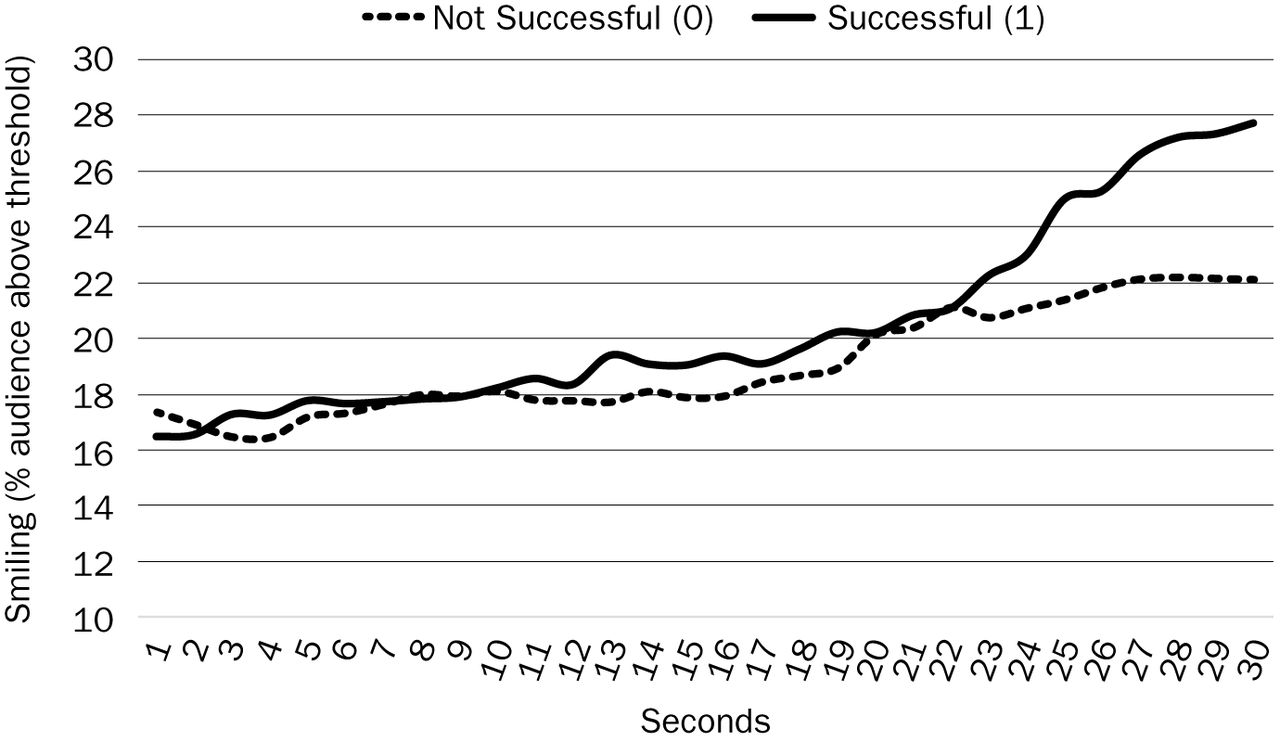
The authors' neuromeasures demonstrated the difference in smiling response between the successful and unsuccessful advertisements (See Figure 1).
The successful advertisements had a rising slope of smiling response. The measure of smiling was an audience measure, the percentage of the audience genuinely smiling. A rise in this measure of smiling indicated that more of the audience was smiling with each additional second of the advertisement—the humor was becoming more infectious and developing scale.
Successful advertisements in this dataset also tended to have higher scores on traditional measures (e.g., free recall) but, it is interesting to note, had lower scores on fixation time and brand exposure. Skin conductance did not differ significantly between successful and unsuccessful advertisements, most likely because all the advertisements tried to make every second as exciting (arousing) as possible.

Slope of Positive Emotion (Smiling)
The Humor “Toolbox”
Given the large number of advertisements attempting humor in the current study's dataset, the authors believed that attempts at humor and successful humor (i.e., an advertisement was genuinely funny) needed to be dissected.
Whether or not an advertisement had humor as an objective was based on the current study's coding—that is, whether any second of the advertisement was coded as having “humor present.” There were 49 advertisements (55 percent of 89) classified as having humor as the objective.
Advertisements coded by experts as having humor generally were more successful.
Only 30 percent of advertisements that did not contain humor were successful, whereas
61 percent of advertisements that attempted humor were successful.
Moreover, if an advertisement with humor as an objective was “really funny,” as measured by smiling activity, it outperformed “not-so-funny” advertisements. The humor objective was deemed achieved when the advertisement was actually funny—that is, if 20 percent or more of participants were smiling for 50 percent or more of the advertisement's duration.
Being funny, however, was not the whole secret of creating a successful humor-strategy advertisement. The humor “toolbox” developed for this dataset included a mix of smiling (funniness) and coding (humor technique) variables.
The authors' humor toolbox (See Table 1) included facial coding because of its ability to test the slope and peak of smiling to identify whether an advertisement was truly funny and had the right-shaped emotional trajectory for a low-involvement/transformational advertisement (Hazlett and Hazlett, 1999; Teixeira, Wedel, and Pieters, 2012). The authors also believed that expert coding was important, primarily for identifying whether humor was an objective. Furthermore, expert coding of humor techniques potentially delivers an important layer of insights for copy and branding strategy (e.g., brand consistency).
The following variables were found to indicate in-market success, correctly separating success from failure for 69 percent of the advertisements:
High peak smiling at the end of the advertisement. Out of all biometric variables, the average of the peak and the end of the smiling response was the most accurate at separating the good from bad advertisements in this set. Testing whether the advertisement had a peak-end average greater than 25 percent (25 percent of its audience smiling) resulted in 66 percent of the holdout sample being correctly classified as either successful or unsuccessful. This peak-end rule is data driven (the threshold was derived from this dataset), however, so a different cutoff may apply, or the rule itself may not apply, in other datasets.
A positive, rising smile pattern. Successful advertisements (scoring 3s or 4s, i.e., “good” or “excellent”) were characterized by an upward slope of smile (percentage of people smiling above threshold over time). This rule did not depend on data from a specific sample. If the slope of smile for any single advertisement was significant and positive (t > 2), this correctly classified 61 percent of advertisements as successful or not successful.
Specific humor techniques used. The most effective type of humor was the kind described as “identity based” (Berger, 1976) or “unclassifiable/miscellaneous” (Buijzen and Valkenburg, 2004). This style of humor includes techniques such as imitation, impersonation, eccentricity, sexual allusion, repetition, or grotesque appearance. If any of this set of “identity/miscellaneous” humor techniques was present, 69 percent of advertisements in this dataset were correctly classified as either successful or unsuccessful, just by means of this variable. The same percentage correct (69 percent) was achieved if only advertisements with humor as the objective were classified (i.e., no improvement over using the entire sample).
Humor Toolbox Rules
Weeding Out Poor Performers
Another key objective for advertising pretesting is weeding out advertisements that likely would be poor performers. The current authors acknowledged that their humor toolbox still required validation across varied data. Still, they explored various candidate variables to identify a safety-net toolbox for identifying poor advertisements.
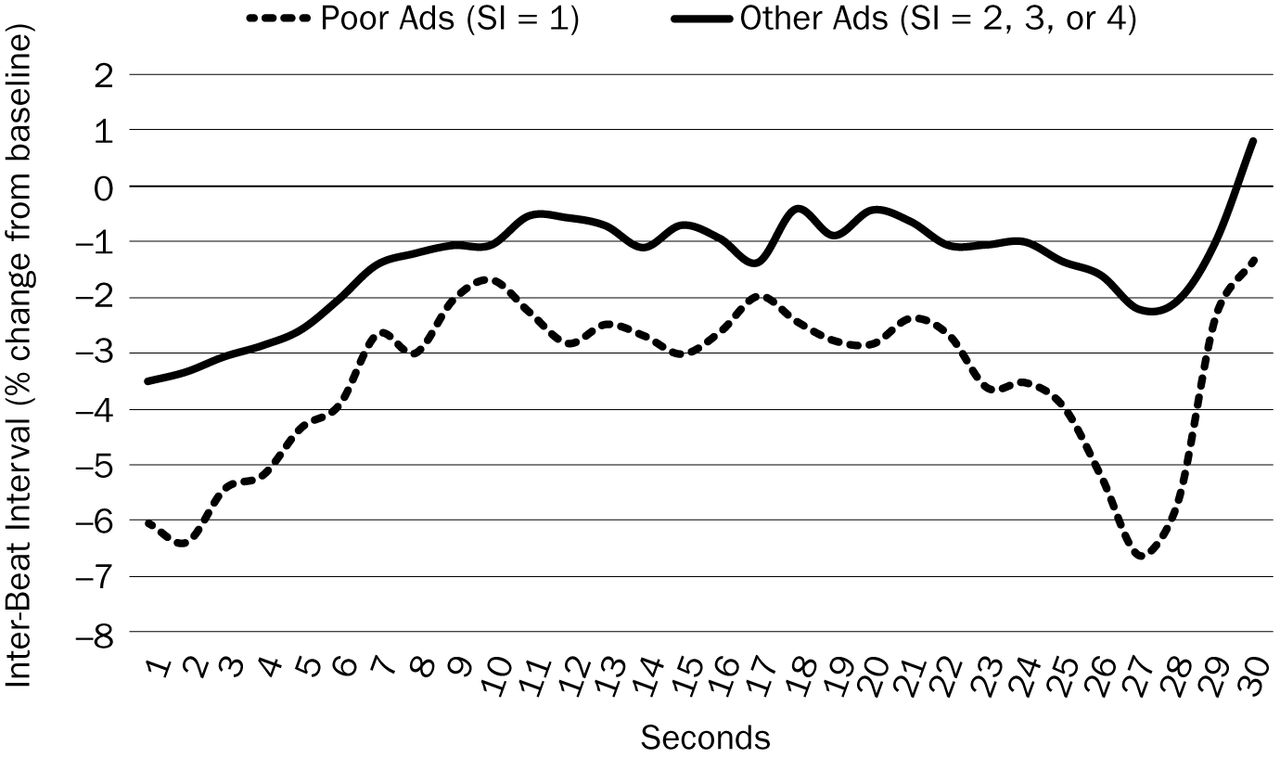
The most important variable in this toolbox was a biometric measure of attention—heart rate. Peaks in IBI (i.e., slower heart rate) have been shown to be biometric markers of what grabs attention (Lang, 1994). Attention clearly is an important factor for successful advertisements (especially in-market, where viewers control what they watch), but in the current dataset, the level of attention was roughly equal for fair, good, and excellent advertisements (2, 3, or 4).
Only poorly performing advertisements were significantly different from more successful advertisements (See Figure 2). Poor advertisements
do not get attention from the start, and
have lower attention levels, on average, for the rest of the advertisement.
Conversely, high attention, measured by IBI (level, number of peaks, duration of peaks), in the first five seconds was a strong indicator that the advertisement likely would get attention at all.
This result suggests that attention, measured by heart rate, is a hygiene factor, similar to hygiene factors in models of job satisfaction: necessary but not sufficient for success (Herzberg, 1968). Bad advertisements in the holdout dataset (n = 19) were identified accurately by a set of rules that included this low attention rule (See Table 2).
What Grabbed Attention?
Most peaks in attention occurred for moments that contained humor, included a twist or change in plot, or showed close-ups of characters' faces. There was no relationship between advertisement effectiveness and the number of these attention peaks. Whether direct branding occurred with these peaks, or before or after the peak, also made no difference to in-market success. All the advertisements in this dataset were well branded and for established brands. This means that the variance in the branding quality was low. Hence, these results need replication with more samples of advertisements across varied conditions.
Slope of Attention (Heart Rate)
Safety-Net Rules
Needed: More Testing Of Traditional Measures
The researchers tried including some rules based on traditional measures in the humor and safety-net toolboxes. They did not find, however, any differences in the calibration sample on these measures between successful and unsuccessful advertisements or between poor advertisements (1s) and more successful advertisements (2s, 3s, and 4s). Similarly, there were no rules, based on these measures, that improved the classification rate in the holdout sample.
The authors admit that there are many different traditional measures and varied ways of testing them and analyzing them. They could not investigate them all. They urge the providers of such traditional measures—or those who claim that combining such measures with biometrics improves predictions—to share their validations. Ideally, their findings should be validated against in-market data or other objective behavioral measures.
DISCUSSION
Advertisers have been presented with a number of ambiguous results from previous studies attempting to validate the use of neuromeasures in advertising research. Those that have predicted sales, for example, have identified different neuromeasures as predictive: fMRI in two small studies (Kennedy et al., 2010; Venkatraman et al., 2015), and EEG in another.3 The authors of the current study advocate that no single neuromeasure seems capable of identifying in-market success. They believe that marketers must select measures that match the intended response from the audience of that advertisement (e.g., laughter or being emotionally moved).
Much more work is needed to know how to analyze individual measures and combinations of measures accurately (Matukin et al., 2016; Shen and Morris, 2016). Only then can the neuromeasures have the potential to validly guide advertising decision making and to predict in-market success.
The current authors believe these results demonstrate the potential of using a toolbox for advertisements with humor as their main objective. Advertisements with the characteristics of a successful humor advertisement (e.g., a rising percentage of audience smiling, a high peak of smiling at the end of the advertisement) were identified to be significantly more successful in a holdout sample than chance would allow. It is no surprise that smiling is related to humor as an objective, especially when smiling means really smiling. The authors set a threshold for what they classified as a genuine smile, removing the likely noise below the threshold. The percentage of the audience smiling above this threshold can be plotted as a test of whether this percentage is increasing over time.
IMPLICATIONS FOR ADVERTISERS
Advertisers know that advertisements do not work through a single mechanism. Advertising works in a range of different ways that are appropriate in different conditions. Very new launches, especially novel offerings, may need to inform and educate; funny, reminding advertisements may be all that are needed to sell chocolate but may not work so well for banking. In fact, there can be a variety of desirable responses to advertising; different biometrics capture different responses. Advertisers, the current authors believe, should strive to know in advance how the advertisement is supposed to work and match validated neuromeasures with that outcome. This thinking should inform future biometric research.
Advertisers who desire positive arousal (e.g., use humor) may benefit from testing their advertisements using neuromeasures of facial expression rather than relying on traditional measures (e.g., attitude or likability scales) or intuition (e.g., unstructured managerial or creative judgment). Many of the advertisements coded as having humor by trained coders in the current study were not actually successful at making the wide audience laugh. If advertisers intend an advertisement to be humorous, they should test the advertisement to see whether it is indeed funny for its intended audience—typically, a broad audience of all potential category buyers.
Advertisers should aim for a rising slope of smiling response, ending in a strong positive reaction at scale—that is, with the majority of the audience genuinely smiling.
In this study's dataset, certain humor techniques had a higher potential for effectiveness, possibly because the brands tested tended to have a very clear creative idea or a very consistent advertising style. In other datasets with different brands or in different cultures, different humor techniques may be more appropriate for generating sales success. Researchers will need many sets of data across conditions to know how far these results generalize and to identify conditions when certain measures are more appropriate.
As discussed, a valuable goal of testing advertisements is to identify the executions that are not effective. The results of this research suggest that low attention is a key factor identifying poor performance. For the advertisements in this dataset, attention from the start was important if the advertisement was not to fail. Although this finding might be true for most advertisements, it requires further testing.
The authors caution about machine-learning-derived measures and predictions based on single studies.
LIMITATIONS
The authors believe their research used the largest and highest quality dataset of this kind in the world to date, to explore the potential contributions of biometric measures. Yet, they acknowledge, the study has limitations:
Despite its quality, this is just one dataset. All the findings relate to this dataset and may not translate to other datasets, especially in diverse cultural settings.
The dataset is dominated by large and successful brands, so the effects of the advertising likely reflect years of branding and advertising creativity that other brands may struggle to achieve.
This dataset skews to advertisements that have humor as the objective and that more likely promote low-involvement transformational products. This limits the generalizability of the results to different sorts of advertising, advertisements with different challenges, advertisements in different markets, and advertisements without humor as the objective.
With this dataset, there were several things the authors could not do. There were not enough examples in the dataset of non-humorous advertisements to allow robust, quantitative insights into what makes them successful. The advertisements featured mainly positive emotions, providing no insight into the differences between successful and unsuccessful negative emotion advertisements. More research with a wider sample of advertisements is needed.
FUTURE RESEARCH RECOMMENDATIONS
This study has shown that neuromeasures, tailored to the specific advertising objective, can outperform traditional measures when predicting in-market success. Much remains to be done in future studies, however, to further understand the “why” behind successful advertising and the conditions that matter:
The richness of these data means there remain fundamental questions. Even without collecting new data, future researchers should explore the differences in biometric responses among light, medium, and heavy category buyers (purchase history was measured in the current study's posttest survey).
New independent variables are being collected—for example EEG measures of potential memory storage—to correlate with traditional measures of claimed memory.
The humor toolbox needs testing in other markets, where differences due to cultural differences in humor and humor techniques can be expected.
The authors recommend replications and extensions of this study, which would include advertisements from other brands, in diverse cultural settings, with other objectives and other sets of emotions.
More broadly, the authors encourage modelers of single sets of data to consider the language they utilize and talk about classifying or identifying, as opposed to “predicting,” unless they are really showing evidence of predicting into the future. Similarly, the authors encourage robust debate and a transparency around machine learning and what it can do and when.
CONCLUSIONS
Using gold-standard validation data—single-source advertising effectiveness measurement, in what the current authors believe is the largest such study conducted to date—this research demonstrates the potential for new neuromeasures to contribute to better understanding of advertising sales success. Likewise, the study articulates new opportunities to use such measures to mitigate risk by identifying poor advertising creative content. Despite the promise demonstrated in the findings, much remains to be explored around the potential contributions of such neuromeasures. That such strong results can be obtained in what is still a relatively nascent field, however, bodes well for the emergence of new tools and methods in better understanding advertising impact in the years ahead.
ABOUT THE AUTHORS
Steven Bellman is the MediaScience research professor at the Ehrenberg-Bass Institute for Marketing Science, University of South Australia. His research on media and advertising responses is funded by the Beyond:30 project, whose sponsors include television networks and advertisers worldwide. He is on the editorial boards of the Journal of Advertising, Journal of Advertising Research, and Journal of Interactive Marketing and was a coauthor of the Journal of Advertising Research's 2015 Best Academic Paper with Duane Varan.
Magda Nenycz-Thiel is Mars, Inc. professor of marketing at the Ehrenberg-Bass Institute for Marketing Science, University of South Australia. Her areas of expertise are marketing metrics, category growth, and online buying behavior. Nenycz-Thiel leads the Mars Marketing Laboratory's marketing research and development effort at the Ehrenberg-Bass Institute, funded by Mars, Inc. Her work is published in the Journal of Business Research, Journal of Advertising Research, and other journals.
Rachel Kennedy is associate professor and a cofounder of the Ehrenberg-Bass Institute for Marketing Science, University of South Australia, where she focuses on producing advertising and media knowledge to help grow brands. Her work can be found in the Journal of Advertising Research, Journal of Advertising, and Journal of Business Research, among other journals, and she is on the editorial boards of the Journal of Advertising Research, International Journal of Market Research, and International Journal of Advertising.
Laurent Larguinat is the director of the Mars Marketing Laboratory, which is responsible for marketing-science research at Mars, Inc. The lab's mandate is to collaborate with academic partners to help establish Mars as a marketing science leader within the consumer-packaged-goods industry.
Bruce McColl is industry professor at the Ehrenberg-Bass Institute for Marketing Science, University of South Australia. At Mars he was global chief marketing officer for ten years, through August 2016, after successive marketing roles starting in 1992. Previously, he had spent eight years in sales and marketing at Schering-Plough Research Institute. During his tenure as Mars's chief marketing officer, the effectiveness of advertising spend increased by more than 50 percent, as measured by single-source data. The company was named Advertiser of the Year at Cannes Lion 2012 and Spikes Asia in 2016.
Duane Varan is chief executive officer of MediaScience, a marketing research firm with offices in Austin, TX, and Chicago. Varan also oversees Beyond:30, a collaborative industry project exploring the changing media landscape. He has been awarded the Australian Prime Minister's University Teacher of the Year, among other accolades, and is published in the Journal of Advertising Research, Journal of Communication, and Journal of Economic Psychology.
Footnotes
↵1 See also Brandt, D. (2016, January 12). “What's next: Emotions give a lift to advertising.” Retrieved on September 19, 2016, from http://www.nielsen.com/us/en/insights/reports/2016/whats-next-emotions-give-a-lift-to-advertising.html
↵2 Brandt, D. (2016, January 12). “What's next: Emotions give a lift to advertising.” Retrieved on September 19, 2016, from http://www.nielsen.com/us/en/insights/reports/2016/whats-next-emotions-give-a-lift-to-advertising.html
↵3 Brandt, D. (2016, January 12). “What's next: Emotions give a lift to advertising.” Retrieved on September 19, 2016, from http://www.nielsen.com/us/en/insights/reports/2016/whats-next-emotions-give-a-lift-to-advertising.html
- © Copyright 2017 The ARF. All rights reserved.
REFERENCES
Vol 57 Issue 1


