
Advertising Research Foundation FoQ 2 Initiative Leaders
George Terhanian
The NPD Group, Inc., george.terhanian{at}npd.com
Christopher Bacon
Advertising Research Foundation, chris{at}thearf.org
Gian Fulgoni
comScore, Inc., gfulgoni{at}comscore.com
INTRODUCTION
Survey research heavily relies on accurate responding by participants to questionnaires. Practitioners carefully must craft their survey questionnaires to avoid biasing these respondents to avoid confusing (and boring) them, all in the effort to achieve as accurate and pure a response as possible. Among the problems for survey researchers to address is response inaccuracy resulting not from the imprecision of one's measures but from the individuals being measured (i.e., from respondent-related measurement error; Groves, 1989). Researchers often confront issues of data quality, including extreme instances where respondents may have to be removed from the final dataset because they clearly were not engaged enough with a study to properly consider and respond to its questions.
Far more difficult to correct (or detect) are the responses from those respondents who are diligent in their completion of the questionnaire but, at times, do not provide fully accurate responses to questions, especially in reference to topics of a sensitive nature. This most likely occurs when the characteristic, behavior, or attitude being measured conflicts with existing social norms and is perceived as being undesirable or even unacceptable by most of society (cf. Tourangeau and Yan, 2007). Simply put, “Survey respondents under-report undesirable activities [and characteristics and attitudes] and over report desirable ones” (Krumpal, 2013, p. 2025).
In 2011–2012, the ARF'S Foundations of Quality 2 (FoQ 2) program implemented a large-scale study with 17 sample providers providing opt-in nonprobability samples to an online survey that ran in parallel to a dual-frame phone survey. The over-arching purpose of the study was to reduce marketers' risk in decisions based on opt-in samples using online surveys. Understanding the impact of social-desirability bias in online comparisons with national benchmarks was one initiative of the FoQ 2 study.
The authors of this report found social-desirability bias, as an effect in self-reported data, associated with a very wide range of topics that are commonly measured in surveys. These topics include subjective and objective phenomena, such as
personal characteristics (e.g., one's height and weight);
behaviors (e.g., making charitable donations, past election voting history, cheating on income taxes);
beliefs and attitudes (e.g., belief in God and attitudes about racial equality, ratings of brands and companies).
BACKGROUND
There is a history of methods attempting to reduce the magnitude of social-desirability bias, ranging from a “truth-detection device” (Nederhof, 1985, p. 272) to simpler methods of “indirect questioning” that involve asking about “unspecified others, rather than the self” (Fisher, 1993, p. 303).
Survey methods, nevertheless, have changed relatively little in light of this consideration. Since systematic probability polling began in the 1960s, participants consistently have reported higher levels of likely voting than what has turned out to be the case. A preponderance of evidence suggests that self-reported voting turnout is affected by social-desirability bias (e.g., Holbrook and Krosnick, 2010; Karp and Brockington, 2005). Some scholars characterized “the need of subjects to respond in culturally sanctioned ways,” as part of the impetus to create a 33-item psychometrically reliable measurement scale to assess people's proclivity to exhibit this self-report bias (Crowne and Marlowe, 1960, 1964).
Psychologists and other social scientists have argued that social desirability is composed of two distinct dimensions (Krumpal, 2013) that relate to
an individual-level stable personality characteristic, whereby some people are much more prone to exhibit social desirability in reporting information about themselves than are other people;
characteristics of a survey—including the manner in which questionnaire items are worded, ordered, and formatted and the mode by which the data are gathered—which lead to more socially desirable behavior exhibited in the aggregate.
As noted above, social desirability consists of bias in responding that can be associated differentially with survey items and the mode of data collection as well as with individuals. That is, whereas certain persons more likely than others would provide socially desirable responses, certain survey items and modes also more likely would elicit socially desirable responses than others (Holbrook and Krosnick, 2010; Philips and Clancy, 1972). Thus, it is generally accepted that the tendency to respond in socially desirable ways is not uniform across all studies.
Some have proposed “that in the presence of an interviewer, some respondents may be reluctant to admit embarrassing attributes about themselves or may be motivated to exaggerate the extent to which they possess admirable attributes” (Baker et al., 2010, p. 735). Conversely, these effects do not emerge as strongly in self-administered survey modes (i.e., mail and Internet) that do not have an interviewer present (e.g., Crutzen and Göritz, 2010; Holbrook and Krosnick, 2010).
Topics that have been shown to display significantly more social-desirability bias in human interviewer modes and less social-desirability bias in self-administered modes include
lower health ratings (Baker, Zahs, and Popa, 2004);
lower donations to charity (Taylor, Krane, and Thomas, 2005);
higher racially motivated political views (Chang and Krosnick, 2009);
lower religious service attendance.
Although this body of methodological studies has identified the presence of a social-desirability bias and also reported the degree of difference between modes of survey data collection, it has not determined the relationship with the quality of data collected through self-administered mail and online methods.
Furthermore, there is a great deal of difference between the probability samples used in these studies and the nonprobability samples commonly used in market research. For this reason, it is difficult to disentangle the nature of the sample from the mode of interview to quantify the extent that differences might be because of social-desirability bias.
There have been previous efforts to resolve this issue. One effort involved an attempt to scale item-specific social desirability across a set of 10 behavioral survey questions by asking respondents how “good” or “bad” each of the behaviors were on a 5-point scale (Frisina, Thomas, Krane, and Taylor, 2007). Although the method proved effective in predicting the direction of bias between phone and online data, it had difficulty predicting the magnitude of some of those differences.
A Deeper Dive
During the past 15 years, an increasing number of surveys have been conducted online and then compared with interviewer-administered survey results. To enable more apt comparisons between modes, the current FoQ 2 investigators believe that researchers must be able to estimate not only the direction of bias but also the degree to which it occurs.
And although many other differences exist between modes of survey administration (e.g., visual versus oral processing), the social-desirability bias probably is one of the stronger distortions to control for in understanding modal differences and may even outweigh the impact of sample-selection bias across modes.
Accordingly, the authors of the current report have gathered information about both the direction and magnitude of the social-desirability bias that would be anticipated with specific survey items. They believe that such responses should be effective in predicting differences in data collected across modes.
METHODOLOGY
The Data
The original Advertising Research Foundation (ARF) FoQ 2 project had required each of 17 online sample providers to implement each of three progressively more difficult quotas across an identical omnibus survey.
The sample balancing had taken the following forms:
“Method A” had age by sex quotas nested within region quotas;
“Method B” had Method A quotas plus nonnested race–ethnicity quotas;
“Method C” had Method B quotas plus education quotas.
The total number of completes for the online portion of the study was 57,104.
The phone dataset included a representative proportion of mobile-phone respondents following best practices for dual-frame random digit dialing (RDD) surveys (Baker et al., 2010). In these dual-frame designs, a traditional sample from the landline RDD frame was supplemented with an independent sample from the banks of numbers designated for cellular phones.
Both datasets received poststratification weights for both the phone and online components to adjust for deviations between the final samples and the U.S. general population's characteristics for sex, age, region, ethnicity, and education (Cook, 2014). This was an omnibus study designed not only to examine responses across a variety of topics but also across question types. Additionally, the survey was custom built to allow for testing the effects of survey design decisions ranging from post hoc weighting to quality control.
To approach the question of socially desirable responding, the current FoQ 2 researchers followed a previous example (Frisina et al., 2007) by creating a questionnaire aimed at generating item-specific measures of sensitivity. They reasoned, however, that the previous method confounded respondents' moral compass with commonly held views by using a “good/bad” evaluation scale.
A socially conservative respondent, for example, might feel that homosexuality is a negative trait, whereas a more liberal respondent would not, thereby creating a bimodal social-desirability rating for this attribute (Terrizzi, Shook, and Ventis, 2010). Nevertheless, both conservatives and liberals likely would agree that, on average, homosexuality is an attribute that survey respondents more likely would falsely deny than falsely claim.
To attempt to better capture this phenomenon, the current FoQ 2 researchers asked an independent group of respondents who had not participated in the original FoQ 2 study to appraise the sensitivity of the current study's questions.
The respondents were provided the following instructions:
“You are going to be presented with a set of standard survey questions. In surveys like these, we often find that some respondents are uncomfortable with the questions asked or wish to make a positive impression on the interviewer. Because of this, they provide answers that are not completely accurate in order to portray themselves in a better light. Please read each question carefully and tell us, how likely it is that the average respondent would misrepresent their opinions and by how much?”
Respondents were presented with a five-category response format with responses ranging from 1 (Likely to give a much higher answer) to 5 (Likely to give a much lower answer), adjusted as was necessary to conform to the question wording. The study questionnaire consisted of 28 items, using each of the benchmark-style questions that were contained in the original ARF FoQ 2 survey (See Appendix).
The questionnaire was administered to 998 online opt-in panelists provided by Survey Sampling International—balanced using sampling quotas to 2013 U.S. proportions of sex, age, income, ethnicity, and region (per the U.S. Current Population Survey) in an online questionnaire—with an average duration of approximately ten minutes.
The researchers tested 17 items for those variables that existed in both the online ARF sample and the phone ARF sample, to measure the gap between the two samples. The 17 items were (See Table 1)
drinks in past year
smoking frequency
100 cigarettes in life
12 drinks in life
have cell phone
hours of sleep/night
days underslept
married
driver's license
proportion of calls on cell phone
valid passport
self-reported health
religiosity
church attendance
hours working per week
strengthening physical activity
vigorous physical activity.
The researchers also measured
the relative percentage difference between the FoQ 2 phone and online mean values. (Because of the diverse scaling of the 17 items, deviation was calculated as a relative proportion difference [i.e., phone estimate-online estimate/online estimate].);
the average rating across all respondents for each item within the supplementary study, transformed to be zero centered on the midpoint of the scale. The researchers referred to this score, which serves as the predicted degree of social-desirability bias for each item, as the item-specific social-desirability rating (ISSDR):
Negative ISSDR scores represented an expected underreporting of the behavior in question (i.e., a tendency to expect others to falsely deny this behavior).
Positive scores represented an expected overreporting of the behavior in question (i.e., a tendency to expect others to falsely profess to this behavior).
A score of zero represented no expectation of inaccuracy (i.e., a tendency to expect that others would not exhibit any social desirability in their responses about this behavior).
RESULTS
“Drinks during the past year” provided the researchers with the largest negative deviation noted at −0.152 (See Table 1). Respondents in the ARF phone study expressed fewer drinks in the past year than did those who participated in the ARF online study.
This same pattern occurred for “Smoking frequency,” where the relative deviation between the FoQ 2 phone and online estimates was −0.134. That constituted the second-largest negative differences between the items tested, meaning that respondents in the ARF telephone survey reported smoking significantly less frequently than did respondents in the ARF online survey.
These results corresponded with the expectations of the respondents in the current FoQ 2 researchers' follow-up survey: The fact that “Smoking frequency” received the second-most negative ISSDR score (−0.46; See Table 1)—of items tested— indicated the belief of respondents that it had a high likelihood of being underreported.
The strong similarity in order between the two comparisons was compelling evidence that the magnitude of social-desirability bias had been successfully captured by the ISSDR. The correlation between the paired scores was R = 0.88 (See Table 1). Thus, there was a very high correspondence between what respondents in the current FoQ 2 experiment thought would happen and what was actually observed in the ARF surveys.
Phone-Online Proportional Deviations and Ratings of FoQ 2 Survey Items
Phase 1: The Initial Model
To convert this correlation into an actual predicted effect of social desirability, the current researchers used a simple linear regression of the phone-online deviation for each item on ISSDR with R2 = 0.71, such that each of the 17 survey items tested were treated as observations (See Table 2).
The questions used in their construction made no mention of interviewer effects. Thus, the researchers' ISSDR values should have been unable to predict any source of difference between modes that had not resulted from the social-desirability bias inherent in each question. (And in particular, they should have had no correlation with sample selection biases.)
As such, if the fit of the model particularly had been strong, it would have suggested that social desirability represented a significant share of the differences observed. To the extent that the researchers correctly modeled the effects of social desirability, residual deviations should have represented bias resulting from other factors (i.e., ones other than social desirability, such as sample characteristics). Admittedly, this initial model unlikely would represent the true nature of the relationship between social desirability and the current results accurately enough to achieve that goal.
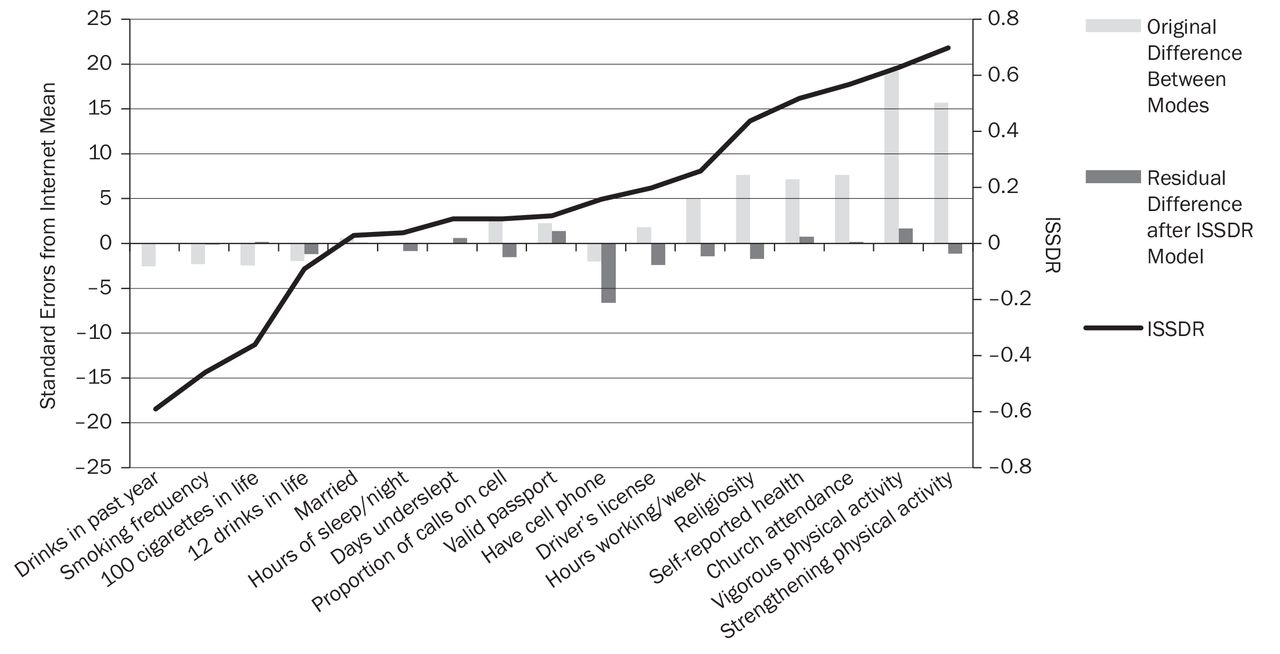
Simple Linear Regression Results
The magnitude of this correction for each of the 17 questionnaire items was prominent (See Figure 1). If social desirability were the dominant driver of difference between the modes, the researchers would have expected the residual errors of the model to be much smaller than the original differences they observed between the phone and online modes. For the majority of the measured variables, corrections for social desirability based on this simple model did reduce the observed differences between phone and online data considerably.
Limitations and Implications of the Initial Model
Although the model did manage to reduce much of the bias from the researchers' original estimates, it had difficulty correctly predicting the magnitude of error of those items scoring the very highest in ISSDR, sometimes leading to estimated correction factors that were much too large. In the case of self-reported health, for example, applying the researchers' derived social-desirability correction resulted in a mean value that was even further from the original online mean—but in the opposite direction—going from a significantly higher to a significantly lower value.
Phase 2: The Enhanced Model (Multivariate)
A simple linear regression was only the most direct application of the data at the researchers' disposal. The researchers could compensate for respondents' nonlinear response patterns by applying a quadratic transformation that emphasized the extreme ends of the scale. Additionally, by creating an interaction between the standard deviation of each item (obtained within the FoQ 2 data) with ISSDR, the researchers could moderate their corrections to conform to the manner in which the diverse question scales in the FoQ 2 items were used (See Table 3).

Bias Corrections Using Simple Linear Regression
Note: ISSDR = item-specific social-desirability rating.
Multiple Nonlinear Regression
This new model achieved an R2 of 0.96 and managed to predict almost all differences between this study's phone and online estimates, to a degree in which only one measure retained a statistically significant difference between the two modes at α = 0.05 (See Figure 2). In almost all cases where large deviations existed between the predictions of the simple linear regression and the observed estimates—such as self-reported health and physical activity measures—the multivariate model predicted deviations almost perfectly. In this case, respondents in this survey indicated that they believed that cell-phone ownership likely would be overestimated by a moderate amount, whereas actual modal differences in the ARF data were very small.
After the researchers applied the social-desirability correction factor, the resulting prediction demonstrated cell-phone ownership among ARF online panelists as significantly higher than among ARF phone respondents. It seemed plausible that this could represent a true difference in sample characteristics when the researchers considered that a set of respondents, who all own computers, likely would own other technology at higher rates as well.
Limitations and Implications of the Enhanced Model
The larger implication of the scale and apparent accuracy of these corrections was that the lion's share of the differences observed between phone- and online-survey modes seemed attributable to social-desirability bias and not to other factors, such as sample selection differences. If sample selection bias were the larger factor, the researchers should not have been able to predict phone-online differences without some measure of sample characteristics—such as demography—that differed between the modes. More than 95 percent of the variance in phone-online differences, however, was explained in the absence of any such predictor.
Bias Corrections Using Multiple Nonlinear Regression
Note: ISSDR = item-specific social-desirability rating.
The researchers acknowledged they could not assert that this finding would hold beyond the set of questions they tested in their experiment. For example, the set of items used included virtually nothing pertaining directly to Internet usage, the area where the researchers had expected authentic differences between respondents surveyed through the two modes to be most prevalent.
The inclusion of a larger set of questions likely would have revealed that the arrived-on model was overfitted to the data and that the small sample size prevented the creation of a validation set. Given the strength of the underlying correlation, however, as well as breadth of the range of lifestyle measures tested, the researchers believed they confidently could conclude that a majority of the modal differences seen in the FoQ 2 study were owed to social-desirability bias.
Testing the Enhanced Model Using FoQ 2 Benchmarks
In addition to establishing a substantial amount of social-desirability bias within the FoQ 2 telephone data, the current results also have implications for data collected in the context of a more rigorously executed dual-frame RDD survey. Theoretically, it may be the case that a telephone survey conducted to more exacting standards—with response rates upward of 40 percent—may be far more defensible as a national standard than that of a commercially generated random sampling of 1,000 phone respondents with a single-digit response rate. The authors of the current report, however, acknowledge they would not expect a more representative sample frame to impact response error.
To test the effectiveness of the multivariate model on data collected by more rigorous means, the current FoQ 2 researchers made use of the same set of 28 benchmarks (questions) that were contained in the FoQ 2 survey (See Appendix). They drew mean estimates from four major government and university surveys:
the Behavioral Risk Factor Surveillance System (BRFSS; U.S. Centers for Disease Control and Prevention [CDC]);
the National Health Interview Survey (NHIS-CDC);
the American Community Survey (ACS-U.S. Census);
the General Social Survey (GSS-NORC/University of Chicago).
Though the 28 questions covered many topics contained within the above four studies, the question wording and response scales used were not all identical. These differences made for a far less ideal testing ground for the current theory. FoQ 2 data, for instance, not only was worded identically and scaled but also was collected within identical time periods. But some benchmark data used in comparative analysis was as much as three years old.
To evaluate the similarity of the FoQ 2's chosen question format to those of the above four benchmark surveys, the authors of the current study asked six research-industry professionals (independent of FoQ 2) to rate each item on a 1–9 scale, where identical questions were granted a rating of 9.
Using the combination of these six independent evaluations, the total set of 28 eligible questions was broken into two sets:
Ten questions received average scores of >7 and were treated as functionally identical.
The remaining 18 questions varied from receiving very low comparability scores to being very near this arbitrary cutoff point, but the cutoff strictly was enforced to avoid the problem of justifying the current results in the context of any substantial differences in question wording.
Once a dataset of comparable questions was created, the multivariate model from the previous section was applied to this subset of identical questions in an attempt at cross-validation. Among these 10 items:
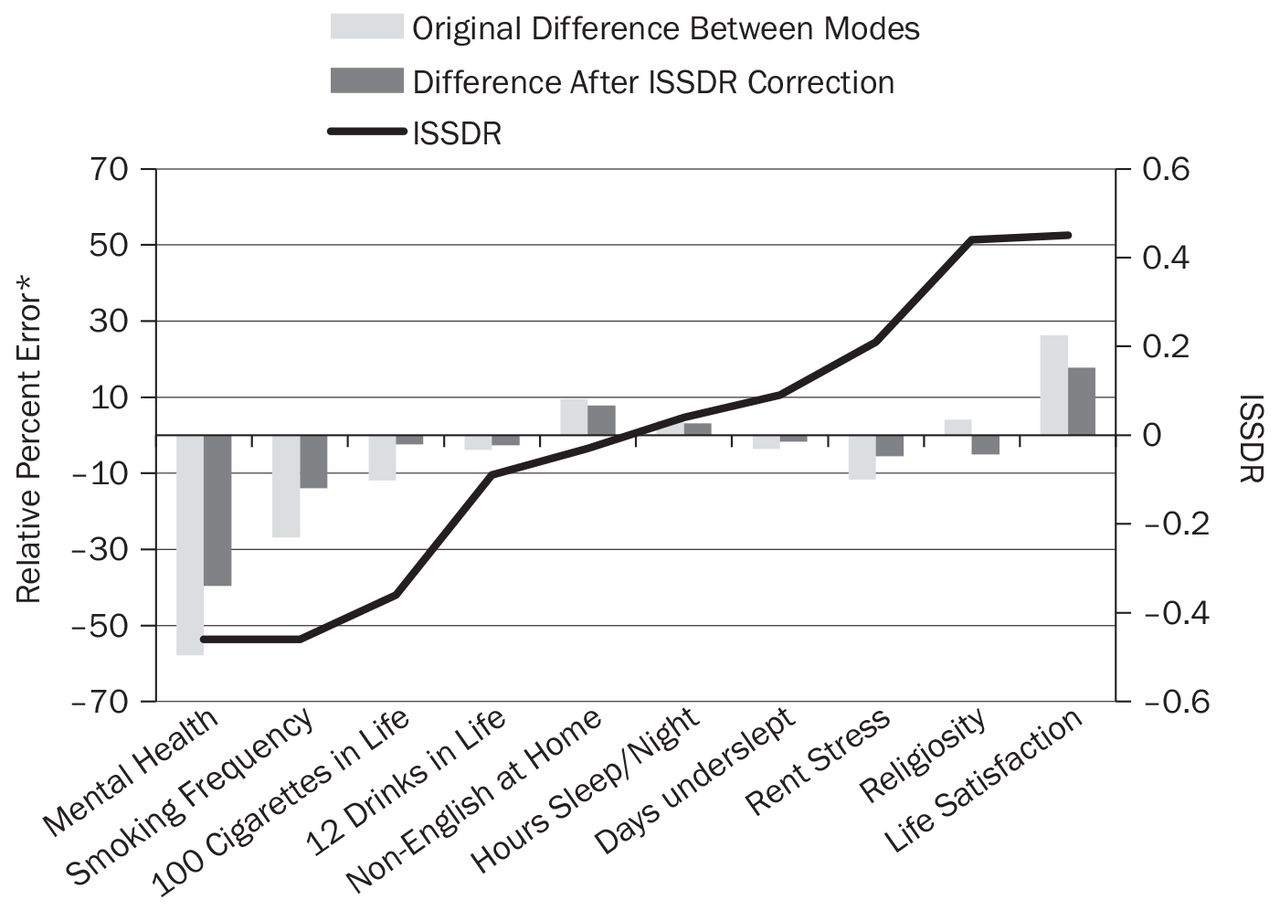
The predictions made in the initial phone-versus-online model continued to explain a significant share of the deviation from FoQ 2 estimates (See Figure 3).
The correlation between the predictions of the model and observed deviations was R = 0.77, with the most notable overcorrection being Religiosity.
An additional and more problematic shortcoming was that a few measures, especially those not used in modeling the FoQ 2 internal comparison, were substantially undercorrected by the model.
Though limited, a sample of 10 observations was sufficient to support the initial finding that observed deviations from interviewer-assisted (in this case phone) modes of research were correlated with expectations of bias.
Ideally, a model could be formulated that better matched the scale of deviations across modes and across questions not originally included in its formulation. The 17 cross-modal items used probably were too few to build such a broadly applicable model.
Additionally, many items with the greatest item-specific social desirability rating (ISSDR) in the survey set were excluded from the FoQ 2 phone study to reduce the length of the interview.

Predictions of the ISSDR* Model Versus Deviations From Benchmark Values
* Note that the error scale along the y-axis has changed, as the standard errors of benchmark estimates are too sensitive to form a manageable scale. ISSDR= item-specific social-desirability rating.
Consequently, when those items were reintroduced to the model, it provided a much smaller magnitude of correction than observed in the pure phone versus online model.
DISCUSSION
It may be a foregone conclusion to many readers that online research is destined to replace traditional phone research in all but the most exceptional circumstances. In large part, this transition already has occurred.
Practitioners and analysts remember a time when data were rooted in probability theory and when inferences about the population were made from surveys without caveats. On average, the differences between the modes are negligible, but whenever a large discrepancy emerges, it casts doubt (perhaps unfairly) on online research as a whole.
What may need to change is the reverence often given to research collected through telephone (and possibly face to face) when comparing results with those obtained online with nonprobability samples. Whether a small study conducted with nonprobability samples to the standards of market research (most often quotas) or a flagship study conducted by a government agency using a stratified probability sample, the social-desirability effects of interviewer-assisted modes may play at least as large a result in modal discrepancies as any form of selection bias. Another more general concern is that for trends across decades, the effects of social desirability most likely systematically have affected results obtained throughout the years of interviewer-assisted survey research.
The magnitude to which modal differences are predicted by the very simple ratings of the concept, which the current study identified as item-specific social desirability (ISSDR), suggests it may play a more general, dominant role in the results of phone surveys. This does not prove that online (or any self-administered mode) will provide an unbiased measurement of any sensitive concept. It does, however, indicate problems with the practice of using standard phone surveys in the pursuit of a representative standard without taking the concept of social desirability into account. In this climate of uncertainty, establishing reliable benchmarks will require the experience of an expert practitioner capable of applying corrections of the sort suggested either in the current or subsequent research.
RECOMMENDATIONS
In the execution of any multimode comparison of data, it is important to consider the effects of both sample selection and social-desirability bias. Even when using data from very reputable sources, the results of such a comparison can be misleading where the questions used are subject to self-monitoring on the part of respondents. Ideally, these comparisons should be made only using questions that respondents do not consider to be sensitive.
The results of the current FoQ 2 investigation suggest several possibilities and further studies could be initiated to identify more, but in large part, it appears that the selection of such items could easily follow one's intuition.
The alternative is the creation of a method for correcting estimates to account for the social desirability inherent in a given question. Such corrections must take into account not only question wording but also be sensitive to differences in mode. The authors of the current study consider their proposed model to be a starting point for such an effort and as evidence that corrections of this sort can be made. Any effective method, however, should be based on studies that include a broader selection of questions than were available to the current research.
The presence of a viable procedure for correcting estimates of social desirability should have far-reaching benefits. With the organizations behind a number of venerable phone and in-person studies (such as the Behavioral Risk Factor Surveillance System and American National Election Study) examining the consequences of switching to more cost-effective modes (often self-administered and online), it is important that the issue of making proper comparisons does not go overlooked.
The authors of the current FoQ 2 report believe that understanding the magnitude of bias present in interviewer-assisted modes—and the degree of correction required for sensitive questions—can improve the accuracy of measurement in all modes of interviewing. Moreover, they believe, it will allow survey administrators to make better-informed decisions about the viability of online modes for their own research.
ABOUT THE AUTHORS
Steven Gittelman is president of Mktg, Inc., a marketing-research firm in East Islip, NY. Gittelman has published numerous papers and four books, including J.P. Morgan and the Transportation Kings: The Titanic and Other Disasters (University Press of America, 2012).
Victor Lange is a research analyst at Catalina Marketing in Saddle Brook, NJ. Previously, and while the article was being written, Lange was a statistical analyst at Mktg., Inc., focusing on devising and evaluating best practices in online survey research.
William A. Cook is chief strategy officer and founder of the consultancy e-Strategic Advantage. Cook has spent decades working in marketing research at DuPont and Kraft General Foods along with a brief stint in academia. An ARF Lifetime Achievement Award recipient, Dr. Cook has played an active role in both FoQ 1 and FoQ 2 and led ARF benchmarking studies on managing marketing assets for sustained returns.
Susan M. Frede is vice president of research methods and best practices at Lightspeed GMI, headquartered in Warren, NJ. From her virtual office in Cincinnati, she oversees various research-on-research projects to improve panel performance, respondent quality and survey data quality for clients. Frede's work has been published in Quirk's Marketing Research Review.
Paul J. Lavrakas is a research psychologist, a research methodologist, and an independent consultant. Lavrakas also is a senior fellow at NORC, the University of Chicago's social-science research institution and a visiting scholar at Northern Arizona University. Lavrakas is the editor of the Encyclopedia of Survey Research Methods (Sage, 2008), coauthor of Applied Qualitative Research Design (Guilford Press, 2015), as well as the author of many other books, chapters, and articles on various aspects of research methodology.
Christine Pierce is senior vice president of audience-measurement methods in Nielsen's global data-science division. Pierce leads a team of statistical, social, and behavioral scientists focused on the development of innovative methodologies across Nielsen's television, audio, and digital services. Her research areas include the integration of big/organic data and panels as well as cross-platform audience measurement.
Randall K. Thomas is vice president of online research methods at GfK Custom Research. With more than 25 years of experience in conducting survey projects across multiple modes and across countries—including research positions at Harris Interactive and ICF International—Thomas has pursued multiple lines of research into measurement accuracy of attitudes, intentions, and behaviors in web-based surveys. His work can be found in more than 20 publications and 170 conference presentations.
APPENDIX
Comparison of Survey Items to Benchmark Values
Footnotes
Editors' Note:
In 2010 the Advertising Research Foundation (ARF) launched the latest phase of its “Foundations of Quality” (FoQ) research initiative—a program designed, in part, to address newly raised questions about the quality of online samples developed. It also sought to address how new sampling methodologies and technologies have developed in a new marketing universe. In 2011 and 2012 the ARF established priorities for FoQ 2, its second large-scale, research-on-online research program, which included study of sample sources and respondent selection. The article that follows is the latest excerpt from that study.
- © Copyright 2015 The ARF. All rights reserved.
REFERENCES
Vol 55 Issue 3


