
Article Figures & Data
Figures
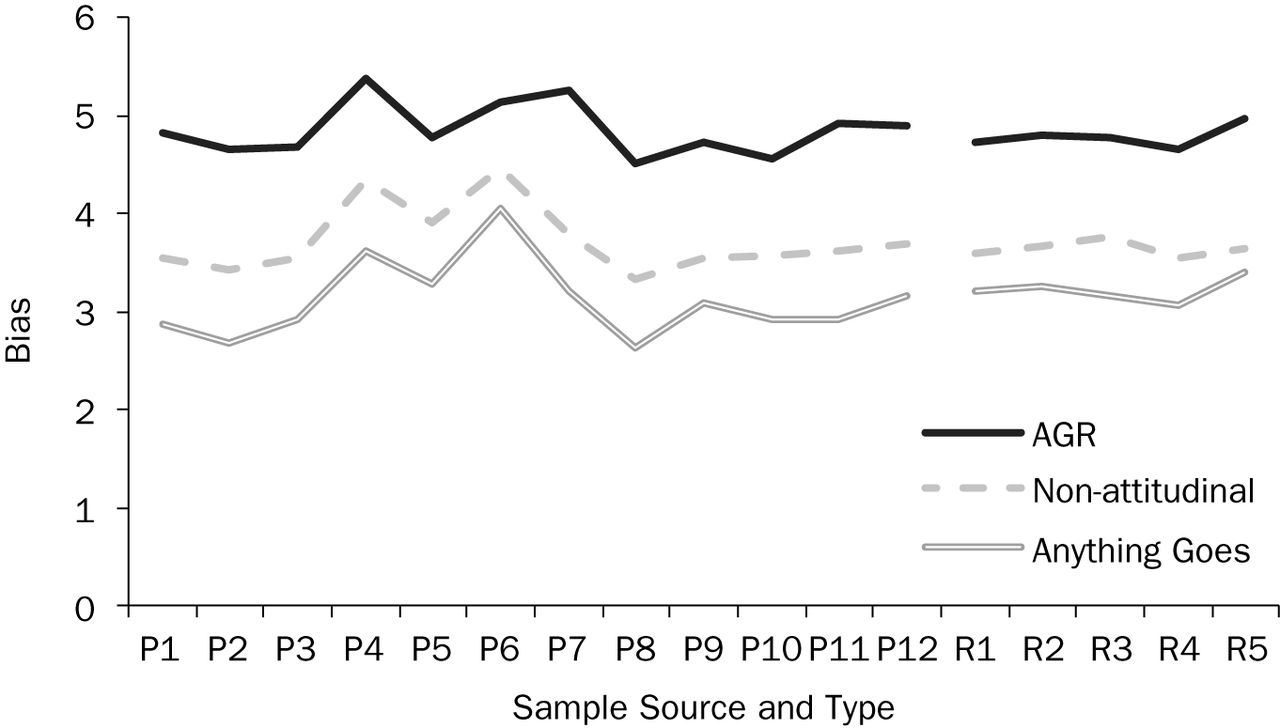
- Figure 1
Bias by Model, Sample Source, and Sample Type
Tables
- TABLE 1
Bias of ICM's 2010 British General Election Forecast
Con Labour LibDem Other Bias Result 37 30 24 10 ICM 36 28 26 10 Bias 1 2 2 0 1.25 - TABLE 2
Quota Specifications for FoQ 2 Sample Providers
Northeast Midwest south West Total Male 18-29 21 24 41 27 113 Male 30-39 14 18 32 21 85 Male 40-49 17 20 33 21 91 Male 50-64 23 28 46 27 124 Male 65+ 14 16 27 16 73 Female 18-29 20 23 40 25 108 Female 30-39 14 18 32 21 85 Female 40-49 18 20 35 20 93 Female 50-64 25 29 49 29 132 Female 65+ 19 22 35 20 96 Total 185 218 370 227 1,000 - TABLE 3
Effectiveness of “Nonattitudinal” and “Anything Goes” Models at Reducing Bias
Variables Model 1 Model 1a Model 2 Model 2a Model 3 Model 3a AGR: Panel AGR: River Nonattitudinal: Panel Nonattitudinal: River Anything Goes: Panel Anything Goes: River Age x x x x x x Gender x x x x x x Region x x x x x x Time Spent Online x x x x Race-Ethnicity x x x x Education x x Income x x Housing Status x x Political Party x Landline Telephone x x # Adults in Household x # Vehicles in Household x x Hopeful x Optimistic x Open-Minded x x Privacy Concerned x x # Variables in Model 3 3 9 9 10 10 # Sample Sources/Providers 12 5 12 5 12 5 Bias, Overall 4.9 4.8 3.7 3.6 3.1 3.2 Bias Reduction vs. AGR – – 1.1 1.1 1.8 1.6 % Bias Reduction vs. AGR – – 23% 24% 36% 33% - TABLE 4
Bias and Accuracy by Sample Provider, Type, and Model
Sample Type Sample Type & Code AGR Nonattitudinal Anything Goes Panel P1 4.8 3.5 2.9 Panel P2 4.7 3.4 2.7 Panel P3 4.7 3.5 2.9 Panel P4 5.4 4.3 3.6 Panel P5 4.8 3.9 3.3 Panel P6 5.1 4.5 4.1 Panel P7 5.3 3.8 3.2 Panel P8 4.5 3.3 2.6 Panel P9 4.7 3.6 3.1 Panel P10 4.6 3.6 2.9 Panel P11 4.9 3.6 2.9 Panel P12 4.9 3.8 3.2 River R1 4.7 3.6 3.2 River R2 4.8 3.7 3.3 River R3 4.8 3.8 3.2 River R4 4.7 3.5 3.1 River R5 5.0 3.6 3.4 Bias 4.8 3.7 3.1 Bias Reduction vs. AGR – 1.1 1.7 % Bias Reduction vs. AGR – 23% 35%
Vol 56 Issue 1


