
ABSTRACT
The advertising–sales relationship remains paramount. This study—believed to be the largest that focuses on automotive sales and advertising—investigates ceilings and thresholds by optimizing budget allocations among media. The study considered 12 vehicle brands in South Africa, spanning 8 years of sales, reflecting sales and media expenditure. It also considers the effect of competitors' advertising expenditure and familiarity on the ceilings and thresholds of each medium, as well as the decay rate of advertising goodwill. Findings suggest that the allocation of expenditure among media types is subject to threshold phenomena. The findings also establish the impact of clutter and familiarity on market share, advertising efficacy, and ceilings and thresholds. Results highlight the interaction between current market share and advertising efficacy.
MANAGEMENT SLANT
A significant portion of advertising is wasted because of suboptimal media allocation that overlooks the impact of clutter, familiarity, and sales percentage difference on thresholds, ceilings, advertising goodwill, and market share.
Empirical data were used on sales and advertising expenditure from the South African automotive market over eight years. Clutter was a significant and large-scale determinant of sales' rate of decay. At high levels of clutter, almost no level of advertising affected market share.
In a highly competitive environment, even when clutter is distributed throughout other media, all media returns are reduced significantly and materially.
In the absence of advertising, goodwill decays, and the model market share decays reasonably rapidly.
INTRODUCTION
Advertising effectiveness can be measured in many ways, but in retail, it generally is considered to be the highest sales response achieved for a given expenditure. “Advertising effectiveness” refers to the market response to a brand's advertising (Tellis and Tellis, 2009). An important adjunct to previous measures of advertising effectiveness (Tellis and Tellis, 2009) is the efficiency with which advertisers achieve their market response—given the expenditure incurred. Recent figures suggest an average efficiency of 66 percent for the top 100 advertisers in the United States (Cheong, De Gregorio, and Kim, 2014), which points to billions of dollars of wasted advertising.
Despite these known inefficiencies, firms continue to advertise and escalate expenditure to boost those campaigns without acquiring an understanding of the optimal strategy to allocate resources across different channels. Their comprehension of how factors such as familiarity, clutter, and current market share can affect optimal advertising-expenditure strategies is often sketchy. Given the established (direct) link between intermedia allocations and advertising effectiveness and efficiency (Färe, Grosskopf, Seldon, and Tremblay, 2004), the lack of understanding of optimal media allocation translates into a gap with respect to how to maximize advertising returns.
To date, only a limited number of studies have focused on maximizing advertising effectiveness through optimization of intermedia allocation, taking into account sales-response factors such as thresholds and ceilings. The impact of clutter has not been investigated in an in-market sales-response study in durable-goods markets with a highly competitive and cluttered advertising environment (such as automotive advertising).
This is a significant shortcoming of many effectiveness and media-allocation studies, especially when one considers the proven link between clutter and advertising response (Danaher, Bonfrer, and Dhar, 2008). No prior study has attempted to link the concepts of threshold and ceilings to the allocation of media expenditure. The impact of clutter, familiarity, and sales percentage difference (SPD) on thresholds and ceilings also generally has been overlooked, as has the dependency of advertising goodwill and market share on such factors.
Using longitudinal sales and advertising data from the South African automotive market, this study addresses these gaps by investigating ceilings and thresholds across multiple media types. The study then optimizes the expenditure allocation among media—the intermedia split—and considers the effect of a competitor's expenditure (clutter) and familiarity on the ceilings and thresholds of each medium and the decay rate of advertising goodwill.
LITERATURE REVIEW
Central to the model employed in this study and the research questions are three ideas:
that different media may interact when used simultaneously, which allows for synergies among media,
that advertising goodwill decays, and, finally,
that media exhibit thresholds and ceilings that are affected by several factors.
Media Interaction
Advertising creates memories, attributes, and frameworks, and these can affect product experience and product-characteristic assessment (Ha and Hoch, 1989). As media-richness theory suggests, each medium has different characteristics, including
the permanence of the advertised message;
the potential for customer involvement;
the threshold and ceiling levels; and
the allowed processing time (Dennis and Valacich, 1999; Lim and Benbasat, 2000).
Such characteristics lead to different efficacy of the medium and memory creation, which, in turn, results in different advertising-goodwill decay patterns (Andrews and Shimp, 1990; Danaher and Rossiter, 2011).
Previous studies demonstrated that the simultaneous use of several media improves advertising response in any one medium, and practitioners often use this feature in planning campaigns (Danaher and Dagger, 2013). This can include only offline media or a combination of both online and offline media (Naik and Peters, 2009) and can be explained through consumers' encoding and retrieval. Advertising encoding is the process whereby consumers learn about the product and the promises made in the advertised message (Ambler, 2000).
This encoding may be assisted by the consumer's exposure to the advertisement on multiple media types. When a consumer is exposed to an advertisement in a single medium multiple times, for example, part of the decline in effectiveness linked to repetition seems to be due to a drop in motivation to process when the same material is received (Batra and Ray, 1986). Other evidence confirms a clear improvement in attitude toward the campaign or advertisement as a result of cross-medium effects (Voorveld, Neijens, and Smit, 2011). When exposed to different media, consumers encode the messages better than if exposed a similar number of times to the same message in a single medium.
Similar to the model of long-term memory encoding and retrieval (from information-utilization theory), the ability to retrieve a memory depends on the degree of accessibility and the availability of that memory. Both accessibility and availability are improved if the consumer forms a better network of information around that memory and more exclusive links to it. Three factors—accessibility (Keller, 1987), availability, and diagnosticity (Trope and Bassok, 1983)—are the primary drivers of the likelihood that the information will be used in the consumer's decision.
The impact of multiple medium types on retrieval therefore also is expected to be positive. Better encoding leads to better retrieval of information. The slight differences in the message mean that consumers may associate diagnostic information with the memories. As per the above discussion, multiple media lead to better encoding of the message, and this makes for more available and accessible memories.
Advertising Goodwill and Decay
Advertising executives place advertisements with the knowledge that the full effect of the advertisement is not within that single time period. There are effects that continue into the future—so-called “lag effects” that can be modeled through, inter alia, the use of a variable called “advertising goodwill.” Advertising goodwill, by definition, is the effect of the current period and historic periods of advertising on consumer recall and intention to purchase (Nerlove and Arrow, 1962). Advertising goodwill has been proven to decline over future periods, and this is the decay of the advertising effect (Nerlove and Arrow, 1962). Decay of adverting goodwill is an important feature of any advertising campaign and depends on a range of factors.
Different media also have different durations of effect (Kinnucan and Miao, 1999). There are several reasons why cognitive processing differs among medium types, thereby allowing unique lags for media. First, the ability to retrieve information from memory networks is dependent on the strength of the memory network for that information. It moreover is subject to a memory-threshold effect and the stronger memory networks established by some media (Chessa and Murre, 2007). Network linkages and probability of recall decay over time; therefore, those media and advertising strategies that provide better information and stronger associations, ceteris paribus, have longer lag structures.
Second, central processing leads to stronger memory networks (Dröge, 1989). The extent to which the media engage central or peripheral processing determines the strength and specificity of the memory traces. Different media have different propensities to engage central versus peripheral processing, in part because of the medium as well as the different consumption styles relating to that medium.
Finally, the extent to which a medium has clutter—competitive or noncompetitive—also determines the extent of forgetting and therefore lagged response. Different media exhibit different levels of clutter from time to time.
Although the majority of previous studies have modeled goodwill decay as a function of the existing levels of goodwill, the current study proposes and empirically tests the effect of brand familiarity and competitive clutter on the rate of advertising-goodwill decay. To operationalize this, the authors used market share as a proxy for advertising goodwill, because the underlying relationship has proven to be linear (Bass, Bruce, Majumdar, and Murthi, 2007; Vakratsas, Feinberg, Bass, and Kalyanaram, 2004).
Threshold and Ceiling in Media
It has been established well that advertising exhibits diminishing returns to scale (i.e., the marginal return to incremental advertising declines). This phenomenon occurs in each type of medium and creates the medium's ceiling. In other words, ceilings are the level of expenditure within a medium where the marginal return on advertising expenditure has declined to near zero (Dubé, Hitsch, and Manchanda, 2005).
Similarly (although less well researched), there is evidence for a minimum advertising level, a threshold, for the advertising campaign to have effect. Hence, by definition, thresholds are those minimum expenditure levels in a given medium below which the advertising response to that medium is zero (Dubé et al., 2005).
There is compelling evidence to suggest that thresholds and ceilings may be conditional on the familiarity of the advertised brand, clutter in that medium, and existing goodwill levels for the campaign (Campbell and Keller, 2003). This study is unique in simultaneously investigating the ceiling and thresholds for advertising response in a multiple-media environment with familiarity and clutter considered.
A ceiling effect can be demonstrated in a laboratory (Campbell and Keller, 2003). A threshold effect is more difficult to examine in a lab because when one is dealing with individuals, even one exposure is enough to lead to learning. When research deals with populations and cluttered media space, each consumer may not be exposed to the advertisement, or exposure may be ineffective in gaining attention and elaboration. As such, there may be a minimum level of expenditure for a target market before there is any response, which indicates that a minimum frequency of exposure may be required before an advertisement or campaign demonstrates an effect on a population.
This study attempts to bridge the gap between the lack of evidence for a threshold in laboratory studies and the inconsistent evidence in empirical (in-field) studies. The study attempts to provide guidelines in terms of the level of expenditure an advertiser should invest in different media for a given budget, as well as the pattern of advertising best suited to spending a given budget.
Two unique aspects of the current study enabled the authors to address the gap in the literature. First, the data-collection mechanism offered a large number of data, delivering a high-powered statistical result with high amounts of independent-variable variability. Second, this study considered clutter simultaneously with estimating thresholds.
The characteristics of the automotive market are that
the products are durable goods,
there are both positive and negative purchase motivators, and
the messaging is both transformational and informative.
Because the study focuses on a single product class, the complexities of using different media for different products are removed, and the recommendations regarding the use of multiple media and the effectiveness of multiple media are derived solely from the media ceilings, thresholds, and interactions.
Factors Affecting Ceilings, Thresholds, and Goodwill Decay
Familiarity. In the auto market in this study, the top five manufacturers account for more than 70 percent of all sales by volume. It is established well that familiarity, in its own right, modifies the purchase hierarchy by creating experiential memories, which are typically more relevant in determining repurchase behavior. This is true for the auto market (Reed and Ewing, 2004).
To understand the role of advertising, it is important to understand whether this high market share (which correlates with high advertising expenditure), together with the high familiarity of those brands, provides a competitive advantage to their advertising when compared with smaller brands. Familiar brands have a preexisting structure in memory, a structure of associations and linkages that facilitates encoding and storage of new messages that relate to the product.
Because there is a lower cognitive load to assimilate new information into existing memory networks (Piaget, 2001), the advertised message regarding a familiar brand is easier to store and recall than the message regarding an unfamiliar brand. Increasing familiarity also leads to lower attribute processing during decision making, because the consumer relies on the brand perception more than attributes (Raggio, Leone, and Black, 2014). Conversely, when a company is advertising an unfamiliar brand, the presence of competitive advertising clutter more likely will hamper encoding of the advertised message.
In addition, familiar brands, in particular, have proven to respond better to consistent but mildly different messaging than to simple repetition. For less familiar brands, however, simple repetition is equally effective in creating improvements to a brand. Often, highly consistent messaging (repetition) leads to better gains in recall and attitude for unfamiliar brands (Delgado-Ballester, Navarro, and Sicilia, 2012). Unfamiliar brands have insignificantly different levels of effectiveness when repetition is combined with advertisement variation.
Familiar brands, conversely, have preexisting networks and therefore with lower levels of effort can create more complex associations. They need advertisement variation to sustain repetition-based improvements in attitude. Hence, familiar brands, through the repetitive exposure to advertising and consumer word of mouth, have well-established memory networks and therefore show a more improved sales response to advertising than do the unfamiliar brands. This should mean that familiarity affects the thresholds and ceilings in different media, as well as the decay rate of goodwill created from advertising.
In a unique contribution to the existing literature, this study includes the impact of brand familiarity when considering the rate of goodwill decay, as well as the impact of advertising for the current period. This study is one of few that have considered the impact of familiarity on advertising response, and it is unique in considering the effect of familiarity on thresholds or ceilings.
Clutter. Advertising affects consumers through the creation of memories and, in so doing, provides information regarding potential choices within a product class as well as information that differentiates between products. In mature markets, advertising exists in an environment with high levels of other advertising (termed “clutter”), which might be either competitive (products in the same or a similar category fulfilling the same need) or non-competitive (the advertisement for the vehicle is seen in the context of advertisements for different product classes). This clutter may affect the impact of advertising by several mechanisms, as, at the very least, the clutter competes for consumers' attention.
Higher levels of advertising clutter are known to cause lower recall (D'Souza and Rao, 1995). Advertising clutter deleteriously affects recall of an advertised message by enhancing decay of memories accumulated through advertising and interfering with learning of the advertised message. Enhanced clutter leads to higher levels of relational processing (Malaviya, Meyers-Levy, and Strenthal, 1999), thus activating other brands' memory schema. The “enhancement of decay” refers to the lower probability that the brand and brand-specific information will be recalled because of the competitive memories and weakened links.
Several studies have considered the impact of clutter on advertising efficacy in isolation. This study's unique contribution is the inclusion of clutter in the advertising response by media type and in the decay of the goodwill thus created. Competitive spend affects different-sized brands differently, introducing the concepts of familiarity and clutter. Larger brand advertising tends to draw sales away from smaller brands, whereas smaller brand advertising positively affects larger brands (Danaher et al., 2008). Empirical evidence suggests that because of the ceiling effect, larger brands typically must spend lower amounts to maintain their market share than smaller brands that are attempting to match that market share (Jones, 1990).
It is clear that clutter significantly affects advertising response. To the best of the authors' knowledge, no study has investigated simultaneously the impact of clutter and familiarity on both the instantaneous effect and the delayed effect of advertising. There also has been no study of high-involvement goods that simultaneously relates clutter and familiarity to advertising response, nor has such a study explored the impact of the difference between market share and share of voice on advertising effectiveness. A simultaneous assessment is necessary because it contributes an understanding of the relative importance and scale of impact of these factors.
METHODOLOGY
The aim of this study was to investigate the levels of ceilings and thresholds, as well as the advertising-goodwill decay function, and to estimate the impact of various environmental factors on those levels. The study also aimed to provide guidelines through which improvements in efficiency and effectiveness of advertising can be achieved. To achieve these goals, the authors employed a generalized nonlinear, dual-stage regression model that can estimate the direct impact of the environmental factors on levels of ceilings and thresholds. Such a model must account for the decay of goodwill and ideally utilize underlying concepts or models that make the results comparable to prior studies.
Data Collection
This study utilized sales and advertising-expenditure data from the automotive market in South Africa over a period of eight years. The advertising-expenditure data were monthly data by model provided by Nielsen, and the vehicle sales-volume data were provided by Response Group Trendline. These providers capture complete market volumes on a monthly basis for both the advertising expenditure by model and the sales by model. This makes this study one of the few that had a complete set of market data from which to select a sample.
Descriptive Statistics of the Variables
The dataset incorporates the full data on sales of light commercial vehicles of the top 12 brands in South Africa and their advertising by month from 2004 to 2012. The top 12 auto brands in South Africa represent 80 percent of all sales. Their advertising expenditure is recorded by Nielsen and represents 70 percent of “above the line” advertising expenditure for new vehicles.
Both the media and the auto industries in South Africa are sufficiently advanced to allow these findings to be generalized to other markets. Monthly data avoid some of the aggregation bias highlighted by previous authors (Tellis, 1988). Monthly data also provide the independent-variable variability required. The much higher variation in expenditure levels should mean that this study is able to show the thresholds and ceiling levels as well as find the goodwill-decay rates. Finally, monthly data provide for short-term effects and captures these results. The authors provide descriptive statistics of the main variables in the model (See Table 1).
Model Development
The proposed model is based on a goodwill model from previous research (Nerlove and Arrow, 1962).
 (1)
where goodwill (A) is related linearly to sales and is estimated through market share of the specific subsegment of the market, qu(t) is a logistic model, and δA is a generalized linear model.
(1)
where goodwill (A) is related linearly to sales and is estimated through market share of the specific subsegment of the market, qu(t) is a logistic model, and δA is a generalized linear model.
The model specification used by prior authors (Nerlove and Arrow, 1962) calls for the determination of the accumulation and decay of goodwill as stand-alone constructs. This study, however, aimed to understand the factors that cause the decay and accumulation of goodwill and market share, and those factors being tested, as described in the literature review, are common. It therefore was not possible to model the function directly so that there was concurrent modeling of the decay function and the advertising function, because the common factors led to multiple-solution problems.
Hence, the problem was divided into two sections, in a manner that mirrored the concept of the Nerlove–Arrow model. The revised form conceptually is
 (2)
This is a unique approach and was used to improve the sensitivity of the model to thresholds, ceilings, and the impact of factors on decay rates of market share and of advertising goodwill. The corollary of the Nerlove–Arrow formulation was used:
(2)
This is a unique approach and was used to improve the sensitivity of the model to thresholds, ceilings, and the impact of factors on decay rates of market share and of advertising goodwill. The corollary of the Nerlove–Arrow formulation was used:
 (3)
(3)
The estimation of the model must be done in two stages. In the first step, the decayed market share was estimated with only the data from models that did not advertise for a minimum period of three months after a run of at least three months of advertising—the advertising hiatus. This provided a degree of confidence that any decay in market share was due to an underlying decay in advertising goodwill and reduced the noise in the estimate. Once these coefficients were estimated, they formed the decayed marketshare estimate for that model—that is, the market share the model would have attained had there been no advertising.
The second stage of the model, the advertising effectiveness, then was estimated with all of the data and the decayed market-share estimate for that model. The factors were estimated again, but this time only in the f(u(t)) section of the model. As one can see clearly, any attempt to estimate simultaneously the coefficients in the decayed market share as well as the advertising impact would lead to multiple solutions, because the factors are considered in both parts of the equation.
In this regard, Equation 3 models the decay of market share by expanding a previous model (Bruce, 2008), by including several novel variables (see Equation 4).
 (4)
(4)In Equation 4, F is familiarity that is linked to market share, obtained from Equation 5:
 (5)
At−1 is the advertising spending for the brand at time t−1, Mt−1 is the market share for the brand at time t−1, and Ct−1 represents clutter.
(5)
At−1 is the advertising spending for the brand at time t−1, Mt−1 is the market share for the brand at time t−1, and Ct−1 represents clutter.
The function of advertising effectiveness in Equation 3 was specified with a logistic model to accommodate ceilings and thresholds:
 (6)
where SPD is the difference between the share of voice and the market share, which provides a refinement of the impact of familiarity because it incorporates the market share of a brand versus the share of voice. CA represents the interaction between clutter and advertising spending, FA is the interaction between familiarity and advertising spending, and ε, σ, τ, ρ, and λ are parameters to be estimated.
(6)
where SPD is the difference between the share of voice and the market share, which provides a refinement of the impact of familiarity because it incorporates the market share of a brand versus the share of voice. CA represents the interaction between clutter and advertising spending, FA is the interaction between familiarity and advertising spending, and ε, σ, τ, ρ, and λ are parameters to be estimated.
Once the model in Equation 4 was estimated, it was applied to the dataset to provide an estimate of the market share, for each month and for each model, that would have occurred had the model not advertised. This estimate was termed the “linear predictor.”
The second stage of the model used the linear predictor as an independent variable, and that variable reflected the market share that would have been obtained had there been no advertising. The second stage of the model therefore was able to elucidate the impact of advertising expenditure and several other factors on the gap between actual observed market share and “zero-advertising forecast market share.” Hence, the model can be written as
 (7)
where LP represents the linear predictor.
(7)
where LP represents the linear predictor.
As the final touch, the authors incorporated the Herfindahl–Hirschman index (Rhoades, 1993) into the model. The Herfindahl–Hirschman index typically is used in market competition and concentration adjudication by the U.S. Department of Justice in assessing competition queries, particularly in horizontal-merger situations (U.S. Department of Justice and Federal Trade Commission, 2010, § 5.2). A high value of the index (close to 1) represents a market with low concentration, whereas in a market with multiple players, each with a small share of the market, the index approaches zero.
Adaptations of the Herfindahl–Hirschman index have been used in measuring concentration in political collations (Le Maux, Rocaboy, and Goodspeed, 2011) as well as union concentration resulting from market changes in firms (Waddington, 1994). For the purpose of the current study, the authors borrowed this index of concentration to represent media concentration of an advertiser in a given month, which allowed them to demonstrate the effects of media concentration and media spread. Using the index helps remove the serious collinearity problems that often are encountered in studies with multiple media types. It also removes the
challenges of overspecification of the model when each media type and the interaction thereof are considered. In this regard, the model in Equation 7 can be rewritten as
 (8)
(Figure 1 illustrates the model conceptually.)
(8)
(Figure 1 illustrates the model conceptually.)
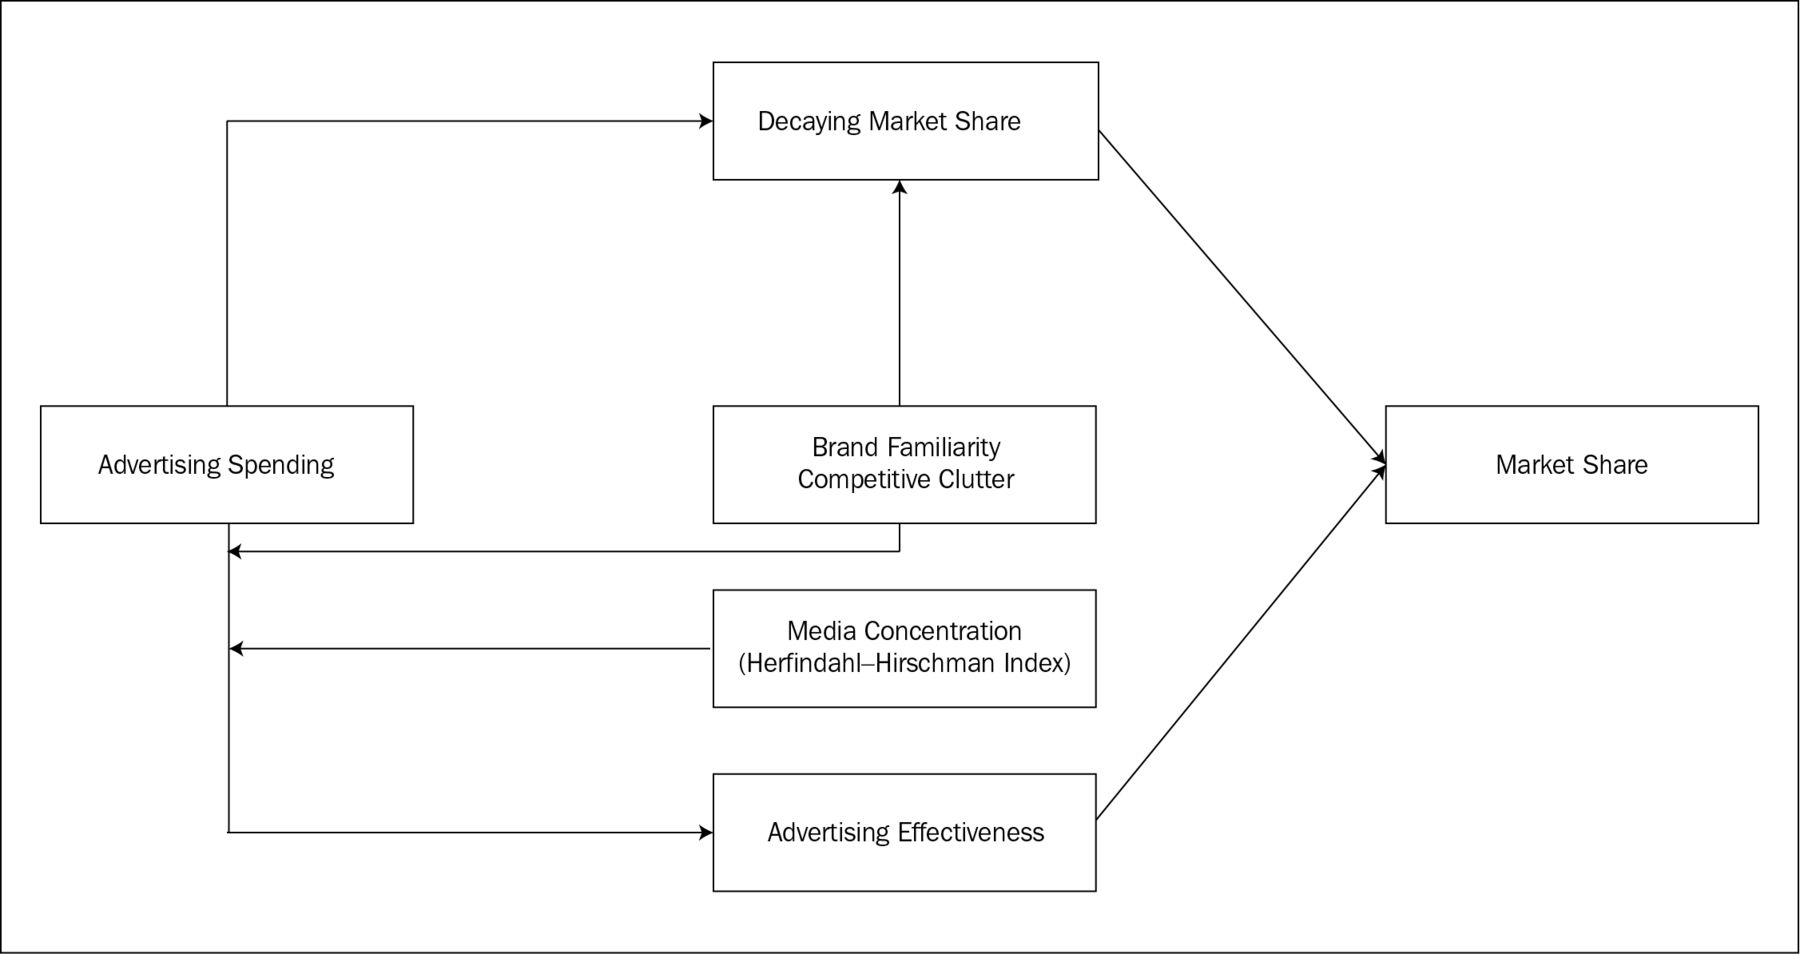
The Conceptual Diagram of the Advertising and Decay Model
RESULTS
A two-stage model was developed whereby the decayed goodwill was estimated first, and then the actual market share and goodwill were modeled as a response to advertising. To achieve this model, the authors divided the data into two categories: advertising runs and advertising hiatus. The advertising-hiatus data were selected for any vehicle model that had advertised for a minimum of three consecutive months and then had stopped advertising. The decay model was created on the hiatus data. That model was then incorporated into the full model, which used all data.
The effect of splitting the function was that the estimation could occur in two stages, and it became possible to partition out the effect of advertising. The descriptive statistics of the two data partitions demonstrate that the advertising-run length varied widely, with some models advertising continuously for very long periods of time (See Table 2).
Decay Function
To calculate a stable estimator of the decay function (in the absence of advertising), the authors merged the data, which were time-series-based panel data, into a single dataset, then used that dataset to estimate the parameters of the decay function as presented in Equation 4. In specifying the model in Equation 4, the authors operationalized advertising spending as the square root of advertising spending on a monthly basis (Dertouzos and Garber, 2006). In keeping with previous research (Danaher et al., 2008), they operationalized clutter as follows:
 (9)
(9)
Description of Advertising Run and Advertising Hiatus
Regression Coefficients for Decay of Market Share
Results from the model in Equation 4 (both with and without clutter) suggest that advertising in the period immediately preceding the no-advertising period had a significant effect of slowing sales decay. Familiarity had a strong positive effect in maintaining sales.
At the end of a model economic marketing period, there are sometimes sales distortions, such as extreme discounting or special offers that lead to sales surges. In this regard, the authors added end of range to the model as a covariate to control for this effect. Models were tested whereby the three months immediately before sales ceased (t = −3 through to t = 0) were compared with the average sales for the period t = −9 through to t = −3. The end-of-range effect was found to be small and nonsignificant (See Table 3).
In addition, where clutter was included as an independent variable, results suggest that clutter could affect a model when that vehicle model was not advertising (See Table 3). It was immediately apparent that clutter was a significant and large-scale determinant of the rate of decay of sales. The factors of end-of-range lag sales, familiarity, and lag advertising spending had similar impacts in the two models. The end-of-range effect was small and nonsignificant.
Advertising Effect on Market Share
Once they obtained the linear predictor, the authors then estimated the model represented in Equation 7 to evaluate the effect of advertising on market share. This also allowed them to identify the determinants of advertising effectiveness both with and without considering the clutter effect in the decay phase (See Table 4).
On this basis, when clutter was not considered in the decay model, the model demonstrated significant (at 5 percent) variables, which accounted for much of the variance in the observed variable and had high statistical power. This makes it a good predictor of advertising effectiveness. The significance of each of the variable coefficients demonstrated a clear and positive impact of advertising on market share. It also demonstrated a negative impact of clutter on advertising response, in line with the literature.
Uniquely in the field of advertising-effectiveness literature, sales-percentage difference has been demonstrated to be a potent variable in moderating advertising efficacy. Familiarity had a small, although significant, impact on advertising response and improved efficacy of advertising (after the impact of sales-percentage difference was considered). In the model in which clutter was considered in the decay phase, it was evident that clutter was still significant. Indeed, the model was almost indistinguishable from the first model (See Table 4).
In sum, the three most important variables, as determined by a combination of the significance of the variable together with the magnitude of its impact on the independent variable, clearly were
the level of advertising,
the clutter for the model, and
the difference of the share of voice to the market share.
Advertising Effectiveness Regression Results
Final Model Including Herfindahl–Hirschman Index
The Herfindahl–Hirschman index (as presented in Equation 8) did not add significance to the final model, so the variable was not included. Interaction variable of the Herfindahl–Hirschman index and advertising spending was deleterious to the efficacy of advertising expenditure, however, which implies that optimal effectiveness was achieved by the use of successive media at higher expenditure levels (See Table 4).
Advertising Effectiveness and Thresholds and Ceilings
The authors then used the model to examine the absolute values of thresholds and ceilings for advertising, as well as the consolidated performance of market share against the independent variable of advertising. In this regard, they adopted three approaches:
a descriptive approach to the data;
an individual advertiser and their expected market share after advertising (this involved allowing the sales-percentage difference to vary but holding the clutter constant); and
a typical advertiser, because it allowed both clutter and sales-percentage difference to move in line with the typical findings change in advertising.
(The typical values for advertisers with different expenditure levels and market shares are shown in Appendix 1.)
Accordingly, the impact of increasing advertising on increasing market share is clear. For those brands that are typically less than 2.5 percent of the segment (average = 1.3 percent), should their expenditure be over R1 million per month, their market share of the segment increases to 2.6 percent.
The typical amount of advertising needed to maintain market share also is visible. For those brands that are typically less than 2.5 percent market share, to have a zero sales-percentage difference (i.e., to have their share of market equal their share of voice), they need to spend R100,000 per month. Market share also drives the minimum expenditure required to maintain share, and an increase in market share through advertising is largely independent of initial market share.
As can be seen, for those smaller brands that are less than 2.5 percent market share, expenditure between R1 million and R2.25 million per month raises typical market share to 2.6 percent—an increase of 1.3 percent, which is double the market share. In contrast, for the group whose market share is around 19.2 percent, the same level of advertising expenditure increases their market share to 22.6 percent, an increase of 3.4 percentage points, which is a 15 percent change.
In the case of an individual advertiser with a particular product, results show that should an advertiser with a vehicle model with a 6 percent share advertise, their market share increases. The increase in market share accelerates in low-clutter environments and decelerates in high-clutter environments. A high-clutter environment therefore causes the response-to-expenditure curve to appear to have a ceiling, whereas the low-clutter environment appears not to have a ceiling of effect.
After the impact of the coefficients has been assessed, the curves representing the 6 percent model are representative of those representing other models. Two adjustments need to be accounted for in models of higher initial volume:
The linear predictor showed a lower initial share without advertising (i.e., with no advertising, as demonstrated earlier, larger brands suffered a larger absolute fall in their market share).
Familiarity had a small effect on the predicted market share, producing a slight improvement in the efficacy of advertising at high expenditures. The effect of changing the familiarity of the model was minimal.
Finally, for a typical advertiser at the median clutter level, the authors illustrate the typical relationship between advertising and market share (See Figure 2). The graph takes into consideration the typical increases in clutter and familiarity that are coexistent at all points in time.
The concept of thresholds and ceilings was captured best by an analytical model that allowed them to be conditional on the familiarity of a vehicle model and the clutter that surrounded the vehicle being advertised. The effect of clutter was far larger and was the real contributor to or determinant of a threshold. In a low-clutter environment, there was no effective threshold in the regression models. The minimum level at which advertising expenditure effectively changed market share was determined by the level of clutter. At low levels of clutter, there was no minimum; at high levels, the minimum expenditure to trigger market-share changes was high.
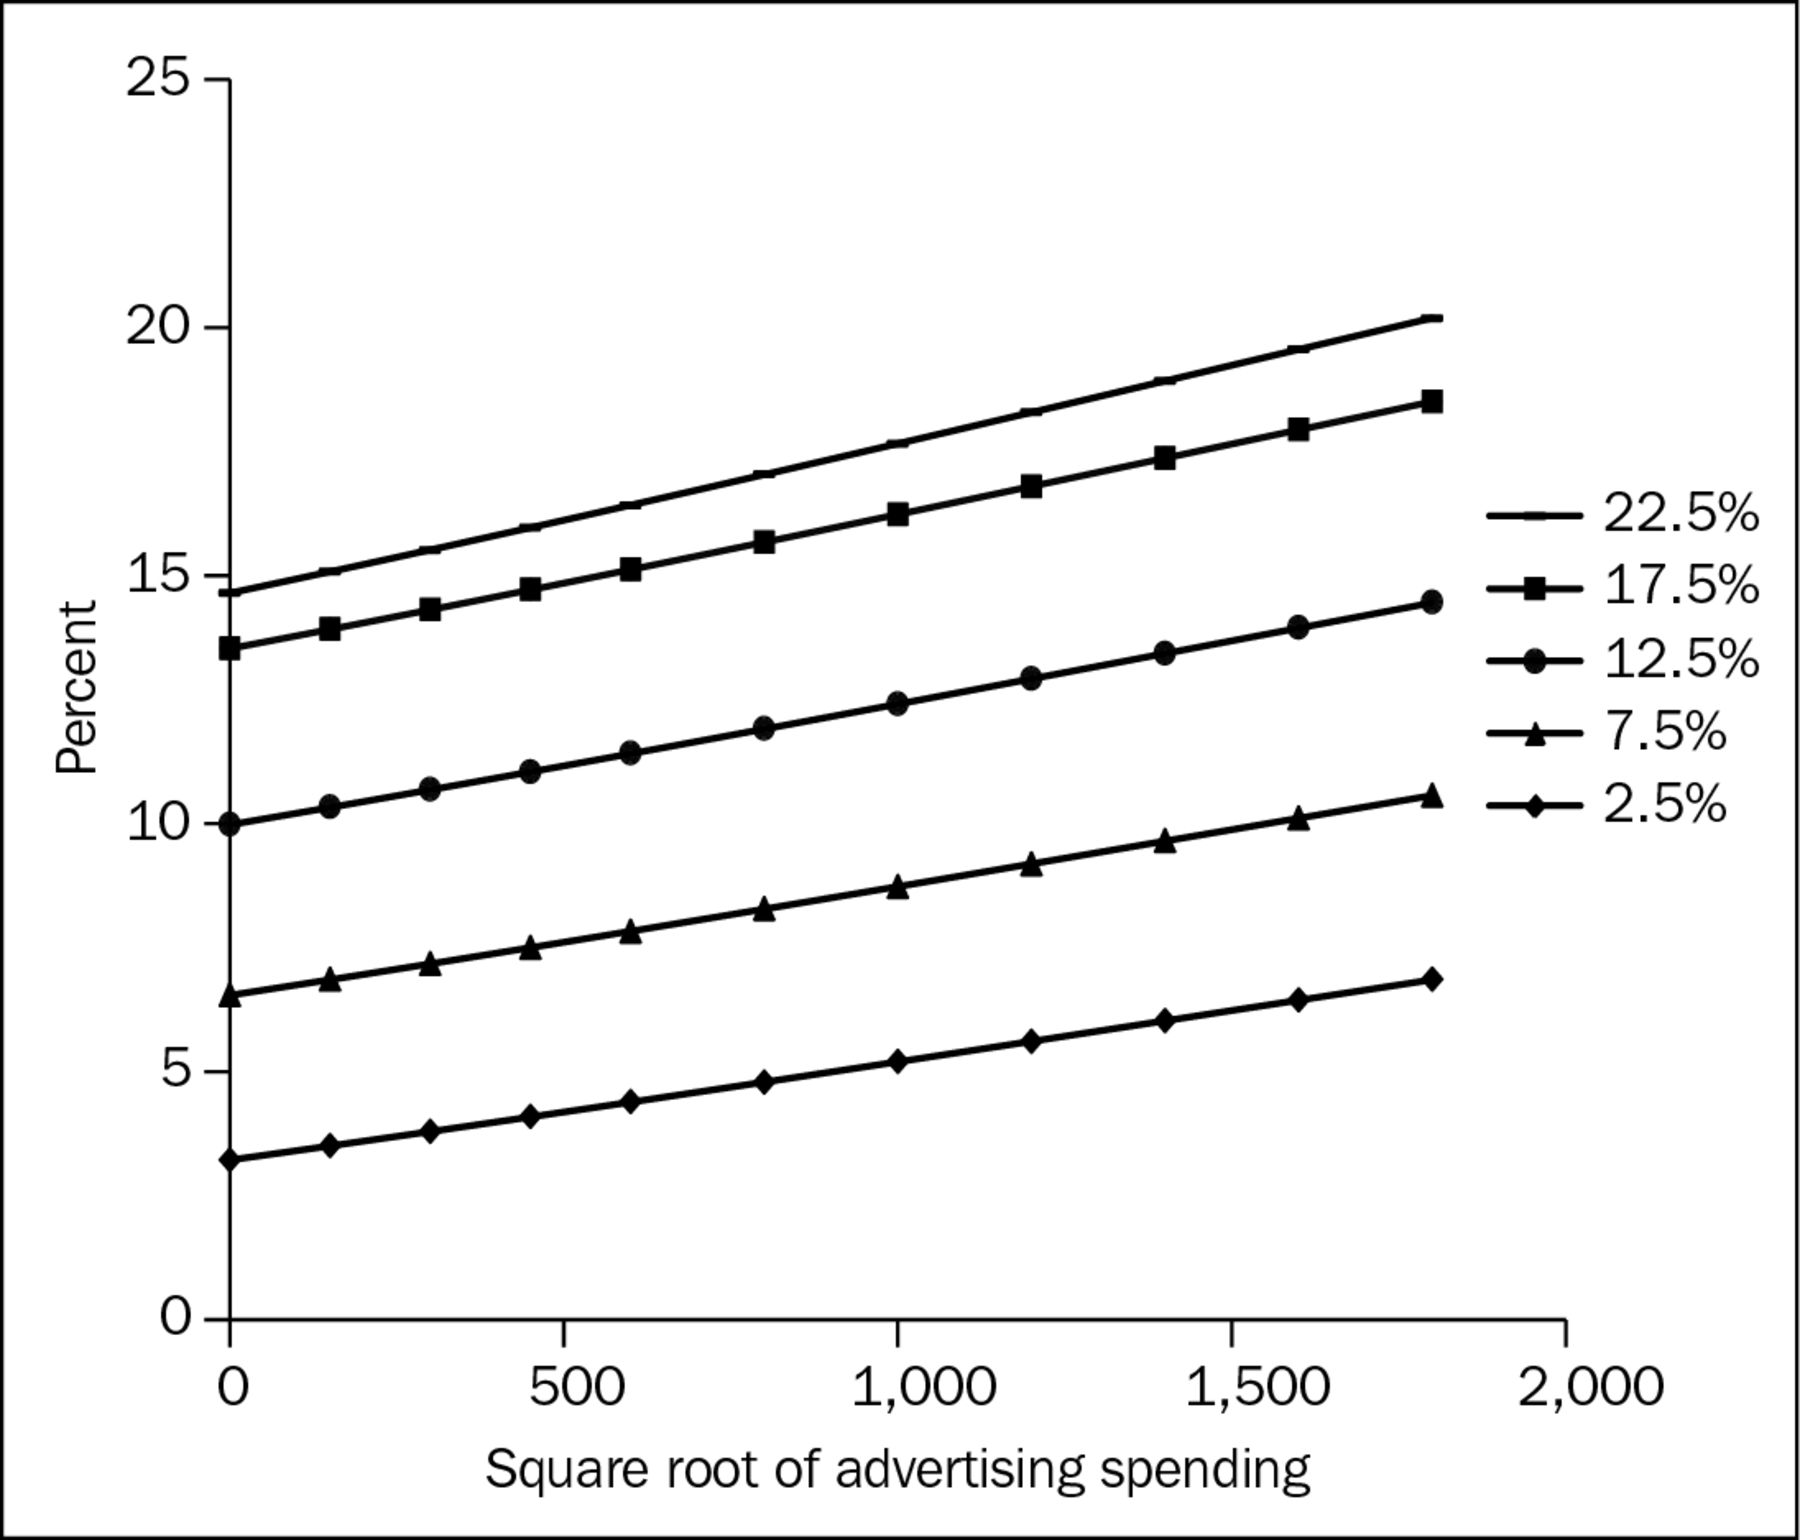
Market Share versus Expenditure, Typical Advertiser In Market
Ceilings were affected similarly by clutter, familiarity, and the sales-percentage difference. Advertising similarly was less effective with increasing expenditure. This feature is demonstrated dramatically by the model.
Accordingly, the regression with the square root of advertising was more effective than with advertising linearly. Results also show that an increase in that advertising led to diminishing effectiveness through
the increased values of clutter × square root of advertising spending,
the increased values of sales-percentage difference, and
the increased values of familiarity × square root of advertising spending.
The ceiling effect was not driven by the upper limit of the logit model as expected, however. The response function to advertising was driven by the interaction of effects in the logit in a zone where the outcome was typically small (i.e., <10 percent). It should be noted that the authors tried several versions of the model in which the full range of the logit function could operate and still returned meaningful scaled results.
Such models included multiplying the final model by a factor such as 25 percent, which would, in turn, allow the logit function to operate throughout the ranges of values allowable. The authors attempted several formulations of the logit model with different nominal factors, as well as multiplying the logit function by the prior market share. None of these improved the fit of the model. None of the variants produced results that were near the zero or 1 limit for the logistic function. This shows that the concept of an absolute threshold, of which number is determined intrinsically, is inferior to the relative (i.e., determined by clutter and familiarity) ceiling and relative threshold concept. This finding is unique to this study.
Advertising Effectiveness in Different Media
A model was created that demonstrated differences in the performance of different media. The model, however, included many variables, and the predictive value was lower than those of the much simpler models.
 (10)
There is a very important difference to note in this version of the model. When the authors considered individual media, the more familiar the vehicle model being advertised was, the more effective was the advertisement in any medium. The significant coefficient on the interaction term familiarity × advertising spending implies that there was a large-scale and significant effect of familiarity interacting with expenditure. This means that in any secondary medium, the familiarity of the brand together with the expenditure in the first medium should boost the returns in the second medium.
(10)
There is a very important difference to note in this version of the model. When the authors considered individual media, the more familiar the vehicle model being advertised was, the more effective was the advertisement in any medium. The significant coefficient on the interaction term familiarity × advertising spending implies that there was a large-scale and significant effect of familiarity interacting with expenditure. This means that in any secondary medium, the familiarity of the brand together with the expenditure in the first medium should boost the returns in the second medium.
Consider the nonsignificant result in radio. Should a familiar brand utilize radio, they would expect a much more positive effect through the familiarity × advertising spending variable than an unfamiliar brand, converting what typically might be a poor-response medium into an effective medium.
This model also demonstrates significant and important impairment of an advertised message through the clutter in the model's advertising environment. In a highly competitive environment, even when clutter is distributed throughout other media, all media returns are reduced both significantly and materially. This model supports media-crossover spillage. If there were no spillage from other media, then the familiarity × square root of advertising spending coefficient would be small in scale of effect. This model specifically allows that should there be high expenditure on any media, this causes a positive response on all other simultaneous media at any given level of familiarity (See Table 5).
Coefficients of Variables for Separate Media Estimation
DISCUSSION
Summary of Findings
To the best of the authors' knowledge, this is the largest study of auto sales and advertising in the public domain. It considered more than 12 vehicle brands, spanning eight years of sales, with more than 10,000 data points reflecting sales and media expenditure. Such a sample is able to demonstrate the complex relationship among advertising, sales, clutter, and familiarity.
The study also employed several novel modeling characteristics to isolate the impact of the independent variables on market share. These included use of the Herfindahl–Hirschman index and a two-stage model of memory and market-share decay that incorporated a nonlinear approach to accommodate thresholds and ceilings.
The outcomes of this extensive study support several important concepts and demonstrate the differences between the vehicle market and other markets. The literature supports these differences. Clutter and familiarity had a significant impact on the decay rate of advertisements and thus created goodwill.
This study clearly demonstrates the impact of clutter on market share, in the absence of advertising. It also demonstrates that familiarity had an impact on the enhancement of initial advertising response and the reduction in response at high levels of advertising. The results demonstrate the dominant effect of the clutter, which led to a significant and material decrease of advertising response dependent on the level of clutter.
All in all, the findings of the current study stretch the boundaries of knowledge in areas such as media interaction, decay of market share, and advertising efficacy. Media interaction is predicted theoretically and proven empirically (Naik, Raman, and Winer, 2005), but few studies have examined several media types simultaneously (an exception is Danaher and Dagger, 2013). In this large-scale, in-market study, there is further clear evidence for the interaction effect of different media, albeit modest in magnitude. The interaction effect was demonstrated in several different ways in this study.
The regression model, which treated each medium separately, showed that familiarity × total advertising spending led to improved responses in all the different media. The implication here is that there was cross-media carryover and enhancement. The scale of the effect was material and could move any individual medium response along the response curve to the section where advertising in that medium drew strong results. This finding is in line with the work of previous researchers (Dijkstra, Buijtels, and Van Raaij, 2005), who similarly found that several media types could affect each other's efficacy.
The study also analyzed market-share decay during periods of no advertising. This is the first time that a model of this type has been used to assess the decay of market share in a market with a high-involvement product. Results suggest that the decay of market share was pronounced and more rapid when a brand was not advertising. Although the decay was slowed by increasing familiarity of the vehicle and brand, when the brand was not advertising, market shares fell significantly.
In addition, the long periods of persistence of advertising goodwill (Naik et al., 2005) appeared to be much shorter in the highly cluttered vehicle advertising environment. Findings suggest that an advertiser who begins with a market share of 10 percent and stops advertising would see 80 percent of the advertising effect decay within 2.5 months; those who begin with a market share of 5 percent would see 80 percent of the advertising effect decay within 3.8 months. These findings are more in line with what is observed in the behavior of advertisers—who seldom have windows in their advertising of longer than four months.
Findings also suggest the significant impact of clutter on the rate of decay of market share when an advertiser is not advertising. Previous research has established well that clutter is deleterious to advertising response (Kent and Allen, 1994). The present authors empirically have demonstrated that clutter, when an advertiser is not advertising, leads to more rapid drops in market share or faster rates of goodwill decline. Market share of any brand declines rapidly in the absence of advertising. The last period of advertising has a carryover effect, but periods prior to that do not. Clutter also was found to be a large determinant of the rate of decay of market share.
This model shows that advertising effect persists for at least a month, but the actual market share of a brand, which incorporates a level of advertising, is the larger determinant of the subsequent month's market share. What is clear is that, in the absence of advertising, goodwill decays, and the model market share decays reasonably rapidly. This effect was demonstrated to be above the effect of any changes in familiarity of the model or brand.
This study also shows that advertisements work from the first exposure and that thresholds are relative phenomena that depend heavily on the clutter levels and then on familiarity. This supports previous work (Gibson, 1996; Taylor, Kennedy, and Sharp, 2009). It is clear that in a model that considers both the familiarity of a brand and the competitive clutter in the advertising environment, the two factors are strong determinants of a threshold for advertising efficacy. This supports early theoretical work (Batra, Myers, and Aaker, 1996) and prior empirical work (Burke and Srull, 1988).
Thresholds may be a function of the current level of market share. Although a positive advertising response can be recorded early on, depending on the level of clutter and familiarity, the level of advertising needed to maintain a market share increases as the market share increases. This intuitive finding introduces a relative threshold, a level below which the market share of a brand declines.
Clutter was found to have one of the greatest effects on the efficacy of advertising. Indeed, the effect was so pronounced that at high levels of clutter, almost no level of advertising had an impact on the market share. The coefficient of the Clutter × Advertising Spending interaction variable had the powerful effect of creating a ceiling for the maximum response of the market to the advertising.
At low levels, the response function performed well, whereas at high clutter levels, the response function was flat (i.e., at its ceiling). This effect is expected when one looks at clutter through previous theoretical work (Chessa and Murre, 2007), in which the high levels of clutter affected the creation and retrieval of memories for products.
In line with previous research (Burke and Srull, 1988; Hammer, Riebe, and Kennedy, 2009), it is clear that the impairment of the recall of a brand's own advertising had a significant impact on the effectiveness of the advertising. These findings also support the previous work on which the model of clutter was based (Danaher et al., 2008) and show that a clutter model that combines both the number of advertisers and the total volume of competitive expenditure is the most effective.
As for the effect of familiarity on advertising response, in this study, the interaction variable of familiarity × square root of advertising spending had a negative effect on the market share—when in conjunction with the other factors. This was an unexpected finding and may be related to the work of previous researchers (Laroche, Cleveland, and Maravelakis, 2006) who showed that more familiar brands did not increase the positive brand attitude with repetition, although low-share brands did. The conclusion is therefore that higher familiarity contributes to higher sustainability of sales, as shown in the decay of sales, but also imposes a slightly lower ceiling of advertising effect. The scale of the effect is much smaller than that of clutter, but high-familiarity brands in high-advertising situations have lower advertising ceilings than low-familiarity brands.
Finally, an important variable that was included for the first time in a study of this nature is the difference between share of voice and share of market. Although the variable has been investigated in other studies (Jones, 1990), this study extends the prior work by including this feature in a model that simultaneously considers both clutter and familiarity. The outcomes of the regression show that this is a highly significant and effective variable to include in the regression.
The coefficient also demonstrated a strong effect of moderation of the effect of high or low levels of advertising and a stickiness to the current market share. This indicates that a particularly high share of voice, which implies high expenditure, not only is subject to declining returns as a feature of expenditure but also is increasingly ineffective at acquiring market share as an advertiser progresses further from the current market share. As share of voice exceeds the market share, the effect of advertising is reduced strongly, and vice versa.
Future Research
There is theoretical evidence to suggest that the decay rate of the market share may depend partially on the media that were used to create the advertising goodwill that underpins that market share. In this study, there was no evidence for such effects. It is plausible, however, that a more specific investigation may find an effect that is particular to specific media.
An improvement on the model used in this study would be to allow the optimal media transition point to be dependent on the media that had expenditure in the model. The authors acknowledge that the use of the Herfindahl–Hirschman index, although novel and appropriate for some findings, obscures the relative contribution of each medium. The recommendations vis-à-vis the ceilings and thresholds therefore may be different in a model that is able to assess each medium separately. Although this was attempted, the outcome was not significantly different from the models derived from the Herfindahl–Hirschman index; hence, improvements may be made in this area.
Finally, the corroboration of the results of prior research (Cannon, Leckenby, and Abernethy, 2002; Cheong, De Gregorio, and Kim, 2010) in the context of this study and with the quantitative results of this study could add additional insight. Those authors demonstrated the continued use of effective frequency as a media-planning tool, and their findings suggest that marketing executives inherently appreciate the concept of thresholds and ceilings. This study did not conduct the qualitative survey to measure the expectation of those executives or test the alignment with the concepts that were demonstrated quantitatively.
ABOUT THE AUTHORS
Nicholas De Canha is executive director of C2 Group, a South Africa-based holding company that provides financing and IT platforms to business within the motor industry. Previously he was marketing director for several global vehicle brands, and the managing director for Renault South Africa as well as for Imperial Fleet Management, a financial services company.
Michael Ewing is executive dean of the faculty of business and law at Deakin University and Alfred Deakin Professor of Marketing. He is also an Extraordinary Professor in the Department of Marketing Management at the University of Pretoria. Ewing's research interests include marketing communications, brand management, and customer retention. He has published 122 articles in refereed journals, including the Journal of the Academy of Marketing Science, Information Systems Research, and the International Journal of Research in Marketing.
Ali Tamaddoni is assistant professor in business analytics at Deakin Business School. His research expertise includes customer churn management, customer analytics, and social media analytics. Tamaddoni's work has been published in the Journal of Service Research, Decision Support Systems, and Industrial Marketing Management, among others. Tamaddoni also has been engaged in a range of research and consulting activities with large online retailers as well as professional sport teams in Australia.
Appendix Typical Advertiser Patterns: Descriptive Advertising Expenditure Effects
- Received March 3, 2018.
- Received (in revised form) June 14, 2018.
- Accepted July 17, 2018.
- Copyright© 2020 ARF. All rights reserved.
REFERENCES
Vol 60 Issue 1


